QQE SIGNALS : ALL YOU NEED TO KNOW
What is the QQE SIGNAL INDICATOR?

Are you looking to take your trading strategy to the next level? With the power of QQE signals, you can unlock a world of opportunities in the financial markets. In this comprehensive guide, we will walk you through the key aspects of QQE signals and how they can give your trading strategy the boost it needs.
The QQE signals become more popular day after day among traders around the world,
So what is QQE signals indicator ?and does it merit to be one of the big momentum indicators
Like macd, sthocastic and RSI ?
In this article, we will dive deep into the mechanics of QQE signals, exploring how they are calculated and what they indicate. We will also provide valuable insights on how to interpret and use these signals effectively in your trading decisions.
Whether you are a beginner or an experienced trader, understanding and utilizing QQE signals can significantly enhance your trading strategy. Stay tuned to discover the secrets of leveraging QQE signals for successful trading!
Unlock the power of QQE signals and watch your trading strategy reach new heights. Let’s get started.
What are the QQE signals?
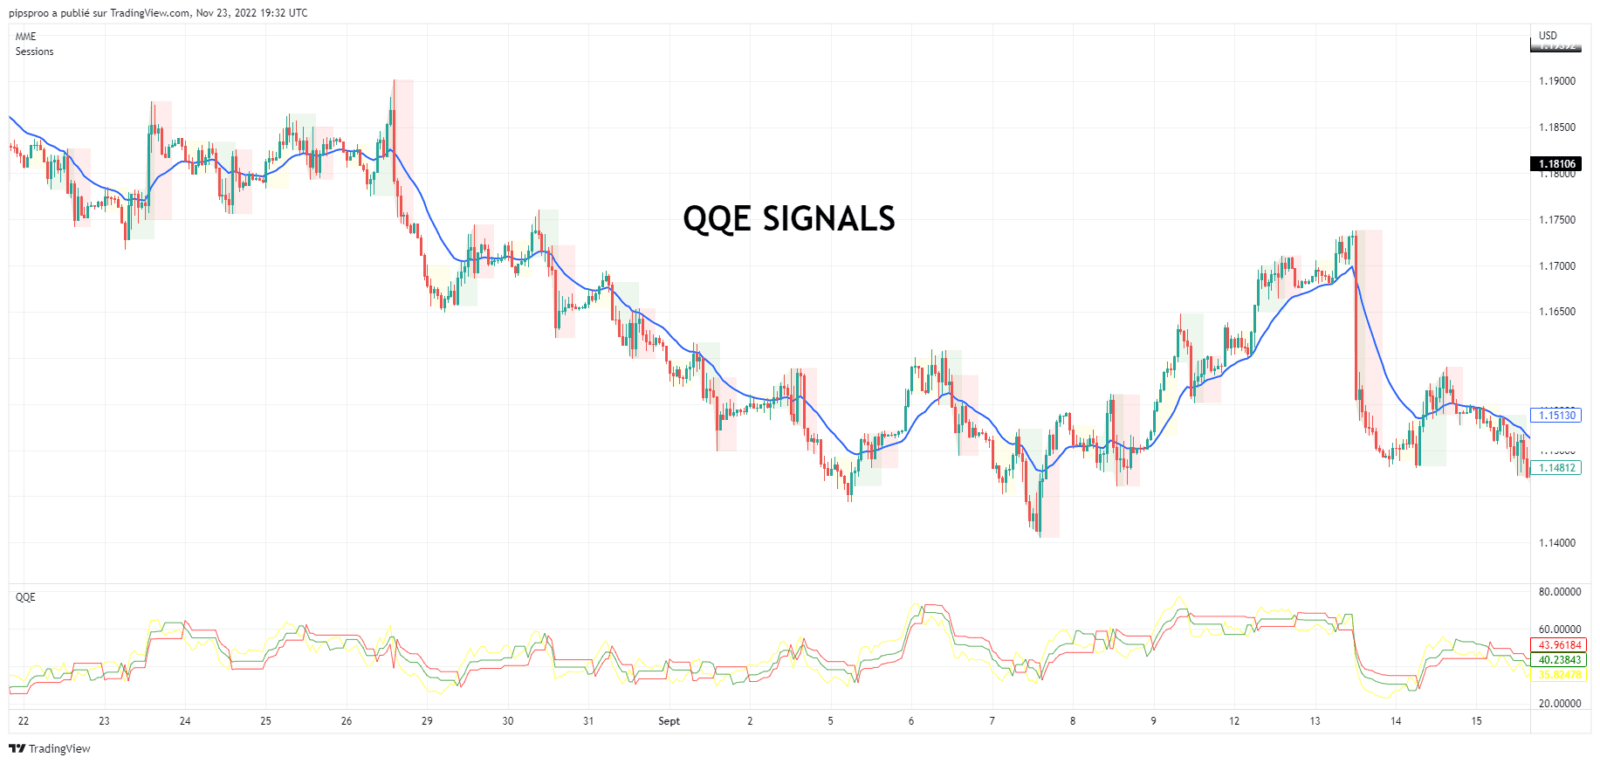
QQE signals or QQE indicators is what we call The Quantitative Qualitative Estimation (QQE) indicator,
we can say that QQE inicators is the beter version of RSI because it helps find
Find the trend direction more accurately and the price momentum of any market.
in general it is a technical indicator that combines multiple elements to generate trading signals. By analyzing price and volatility, QQE signals can help you identify potential market reversals and trends
How QQE signal are calculated ?
QQE signals are calculated by using RSI oscillator ombined with the ATR (average true range),
instead of using the classic RSI, the QQE signal indicator uses Wilder’s RSI, derived from a different
form of the exponential moving average for the smoothing.
This is the mathematical formula :
Wilder’s smoothing = Previous MA value + (1/n periods * (Close – Previous MA))
To understand QQE signals better, it is essential to grasp the concept of overbought and oversold conditions. When a market is overbought, it means that the price has risen too high, and a reversal may be imminent. On the other hand, when a market is oversold, it means that the price has fallen too low, and a potential upward movement may occur.
Advantages of using QQE Signals
What are the benefits of the QQE SIGNALS?
As we said before QQE indicator signal is momentum indicators , thats mean it can help in many Ways :
1. Find the trend direction more accurately :
The QQE signal used to determine the trend with normal Settings,thas mean if the values above 50 ,
we are in a bullish market, while values below 50 indicate a bearish market.
2. Detects overbought and oversold market :
The QQEcan be used to determine whether the price is in oversold or overbought conditions.
As a result, when the indicator rises above the threshold of 70 then we are in an
overbought conditions, while values below 30 indicate oversold conditions.
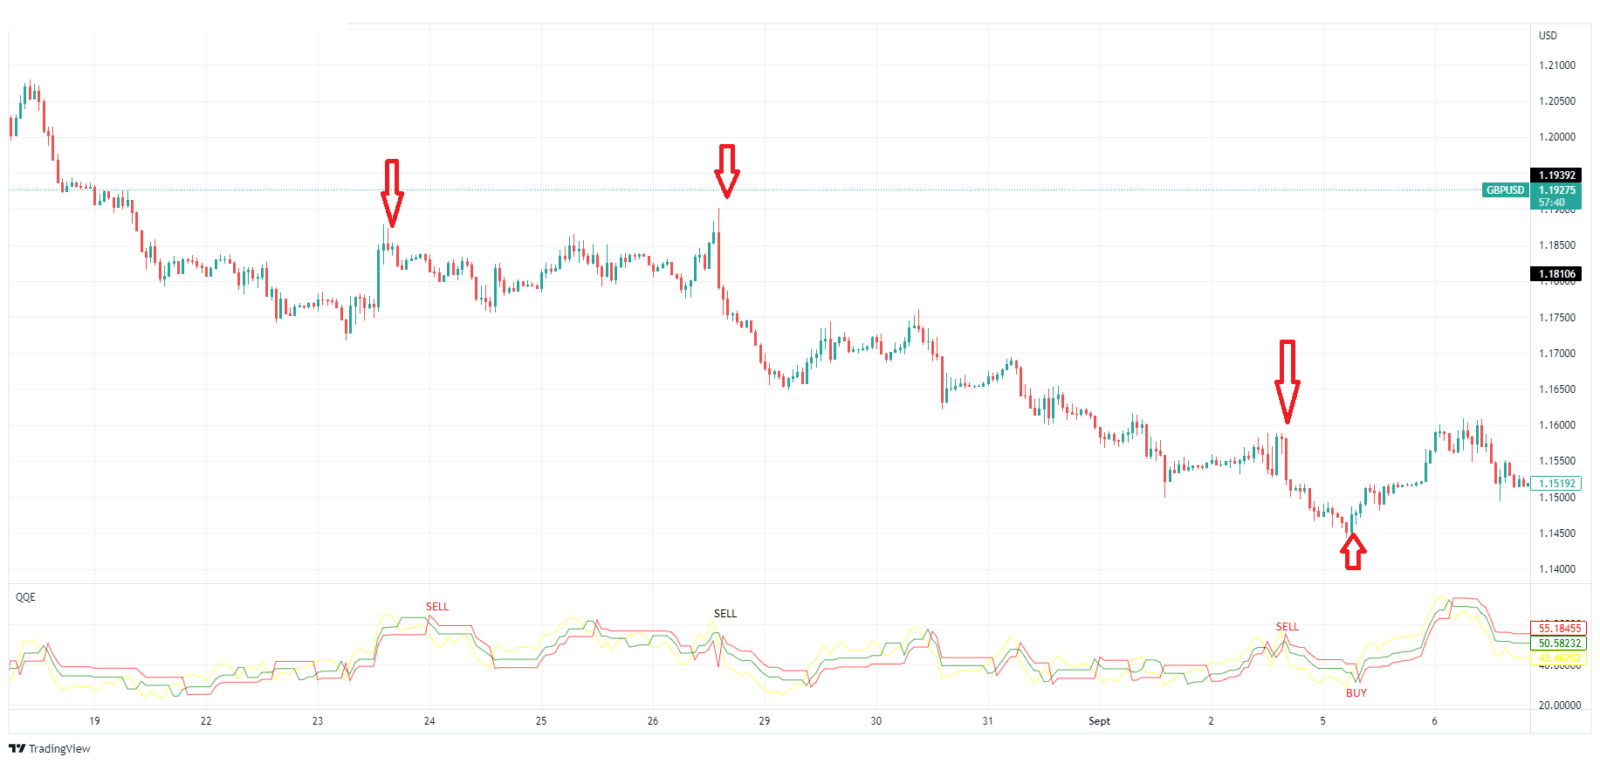
3- Shows the price momentum :
We can take Long trades when the smoothed RSI line crosses above the slow trailing line,
indicating short-term upward momentum. In the other hand shorts may be a better option
when the smoothed RSI crosses below the slow trailing line, indicating short-term momentum is to the downside.
HOW TO USE QQE SIGNAL FOR Day Trading ?
before looking to the strategies you must note that QQE signals are not foolproof and should be used in conjunction with other technical analysis tools. Consider analyzing price patterns, support and resistance levels, and other indicators to confirm the validity of the signal.
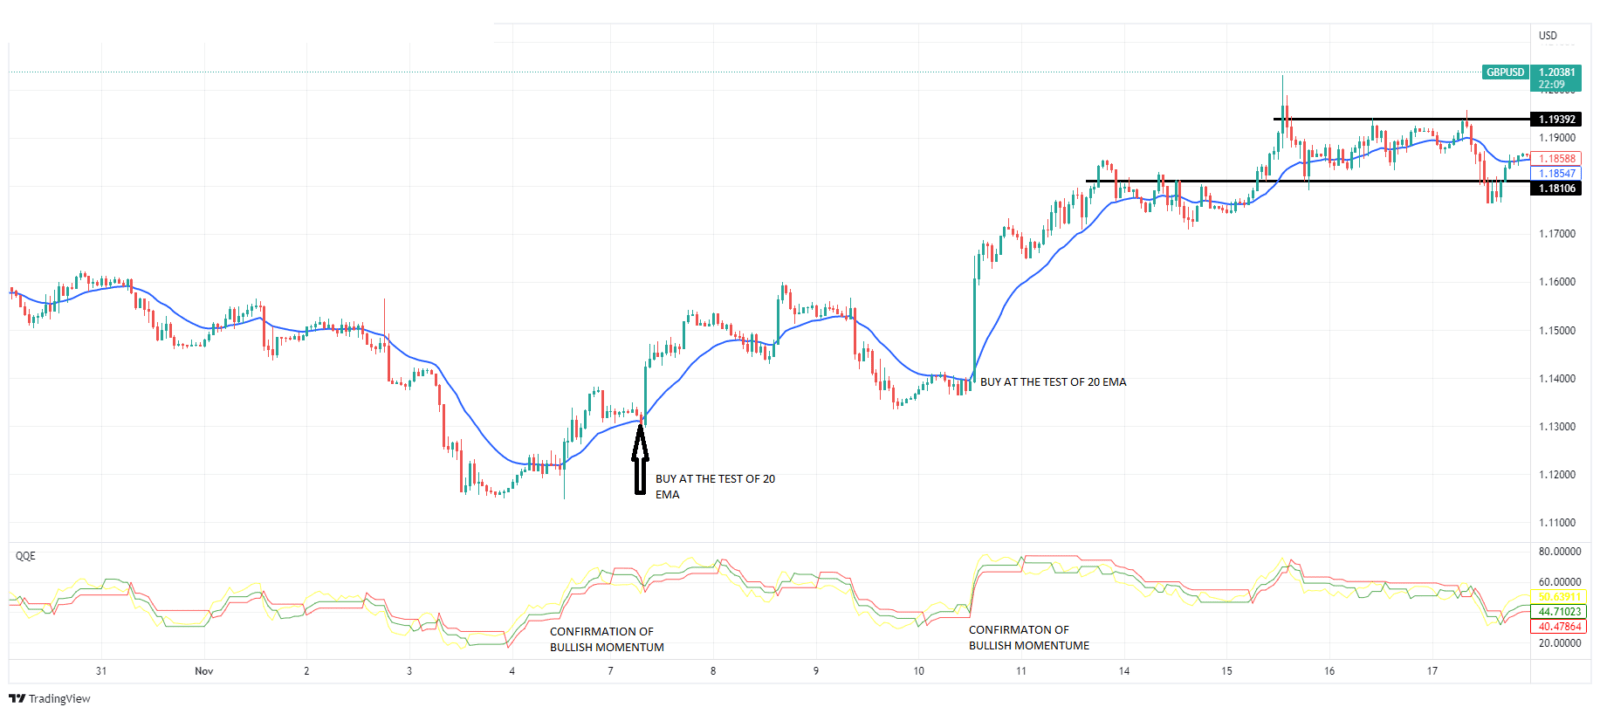
For day trading strategy, we wil use only 2 indicators :QQE signal indicator and the 20 ema
(exponential moving average).
The long trade setup :
We will choose the 15 min as a time frame for the setup, it is better to look for the trade signals
in major currency , or trade volatile market like future contract ,gold or even us oil.
The condition of the long trade setup are :
1-Find an asset in which the price trading above the 20 EMA.
2-In the 15 mn chart wait for the price to test the 20 EMA.
3-At the QQE INDICATOR there must be a confirmation of bullish momentum.
HOW TO SET TAKE PROFIT AND STOP LOSS for LANG SETUP:
TAKE PROFIT:
By analyzing the resistance level on the main chart, we must establish the take profit level.
However, it is important to position the take profit so that the risk to return ratio is greater than 1:2.
STOP LOSS:
As the 20 EMA is your dynamic support level, we may place our stop below the 20 EMA.
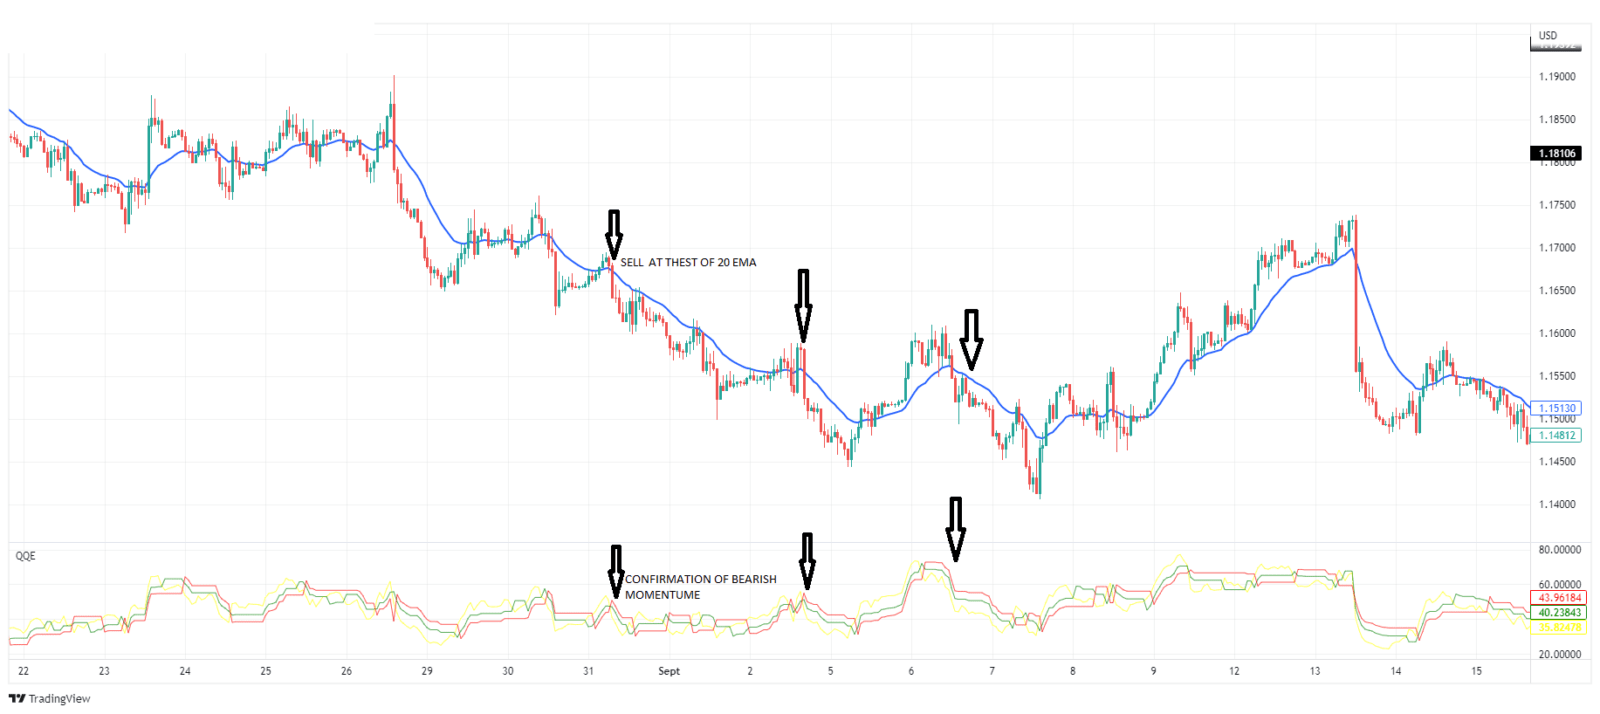
The short trade setup :
We will choose again the 15 min as a time frame for the setup, it is better to look for the trade signals
in major currency , or trade volatile market.
The condition of the long trade setup are :
1-Find an asset in which the price trading below the 20 EMA.
2-In the 15 mn chart wait for the price to test the 20 EMA.
3-At the QQE INDICATOR there must be a confirmation of bearish momentum.
HOW TO SET TAKE PROFIT AND STOP LOSS for SHORT SETUP:
TAKE PROFIT:
Again always respect the 1:2 ratio or higher.
STOP LOSS:
We will always place The stop loss right above the 20 EMA.
To optimize your trading strategy with QQE signals, consider the following tips:
- Combine QQE signals with other technical indicators to increase accuracy.
- Use multiple time frames to confirm signals and identify potential trends.
- Continuously monitor and adjust your strategy based on changing market conditions.
- Keep a trading journal to track the performance of your trades and identify areas for improvement.
- Stay disciplined and avoid overtrading based on QQE signals alone.
Common mistakes to avoid when using QQE Signals
Common mistakes to avoid when using QQE Signals
While QQE signals can be a powerful tool, it is important to avoid common mistakes that can undermine the effectiveness of your trading strategy.
One common mistake is relying solely on QQE signals without considering other factors. Remember that QQE signals should be used in conjunction with other technical analysis tools to confirm trading opportunities.
Another mistake is over-optimizing your trading strategy based on historical data. While backtesting is crucial, it is essential to strike a balance between optimizing your strategy and avoiding data mining bias.
Finally, avoid chasing every signal generated by QQE. Not all signals will lead to profitable trades, and it is essential to exercise discretion when entering or exiting positions.
Resources for learning more about QQE Signals
To deepen your understanding of QQE signals and enhance your trading strategy, consider exploring the following resources:
- Books: “Technical Analysis of the Financial Markets” by John J. Murphy and “Trading in the Zone” by Mark Douglas.
- Online Courses: Websites like Udemy and Coursera offer various courses on technical analysis and trading strategies.
- Trading Forums: Participate in online trading forums to learn from experienced traders and share insights.
- Professional Trading Platforms: Many trading platforms provide educational materials, webinars, and tutorials on technical analysis tools, including QQE signals.