Forex trading is a complex field that involves various trading strategies and tools to help traders make informed decisions. One such tool is the Fibonacci sequence calculator, which is a a series of numbers that can be used to identify potential support and resistance levels in the market.
The Fibonacci sequence Calculator is based on the idea that certain ratios between numbers in the series can be found in nature and in financial markets. These ratios, known as the Fibonacci ratios, include 0.618, 1.618, and 2.618.
How to use and draw Fibonacci sequence retracement levels:
As a forex trader you can use the Fibonacci ratios to identify potential support and resistance levels in the market by drawing Fibonacci retracement levels on a chart. These levels are horizontal lines that indicate where the price of an asset may find support or resistance as it moves up or down.
To draw Fibonacci retracement levels, traders first identify a significant high and low point on the chart. They then divide the vertical distance between the high and low points by the Fibonacci ratios to find the retracement levels.
For example, if the high point on the chart is at 1.4000 and the low point is at 1.3500, the vertical distance between the two points is 0.0500. Dividing this distance by the Fibonacci ratio of 0.618 gives a retracement level at 1.3691, while dividing it by the ratio of 1.618 gives a level at 1.3191
You can use these retracement levels as potential entry or exit points in the market. If the price of a forex pairs is approaching a retracement level and showing signs of reversing direction, you may choose to enter or exit a trade.
In addition to retracement levels, traders can also use the Fibonacci sequence to identify potential price targets. This is done by drawing a Fibonacci extension level on the chart, which is a horizontal line that extends beyond the high and low points. The extension levels are found by dividing the vertical distance between the high and low points by the Fibonacci ratios.
Forex Fibonacci sequence strategy:
Fibonacci sequence strategies are based on the idea that prices will often retrace a predictable portion of a move, after which they will continue to move in the original direction. This is known as a “Fibonacci retracement.” Fibonacci retracements use horizontal lines to indicate areas where the price may potentially experience support or resistance. These horizontal lines are based on the Fibonacci sequence, and are commonly used in conjunction with trend lines to find entry and exit points in the market.
There are several rules that traders may follow when using a Fibonacci sequence strategy:
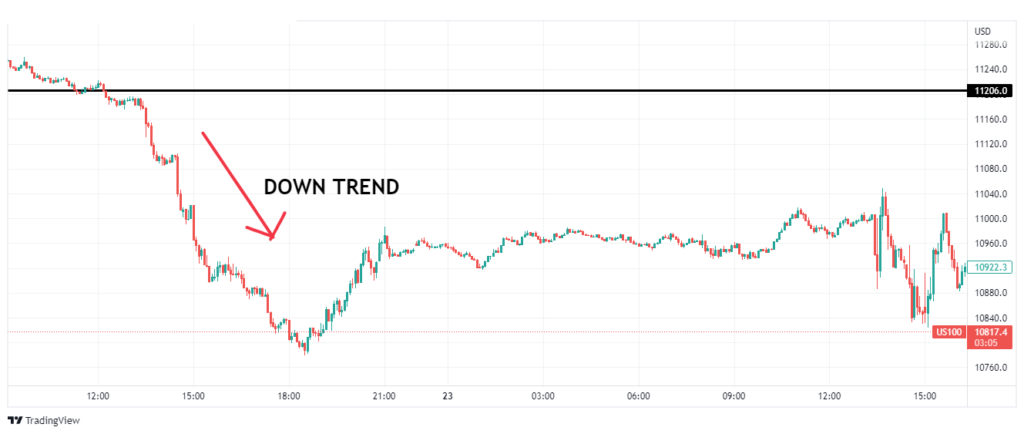
1-Identify the trend:

The first step in using a Fibonacci strategy is to identify the overall trend. Is the market in an uptrend or a downtrend? A Fibonacci retracement can be drawn on any trend, but it is best to use it in a trending market in order to find entry and exit points that align with the trend.
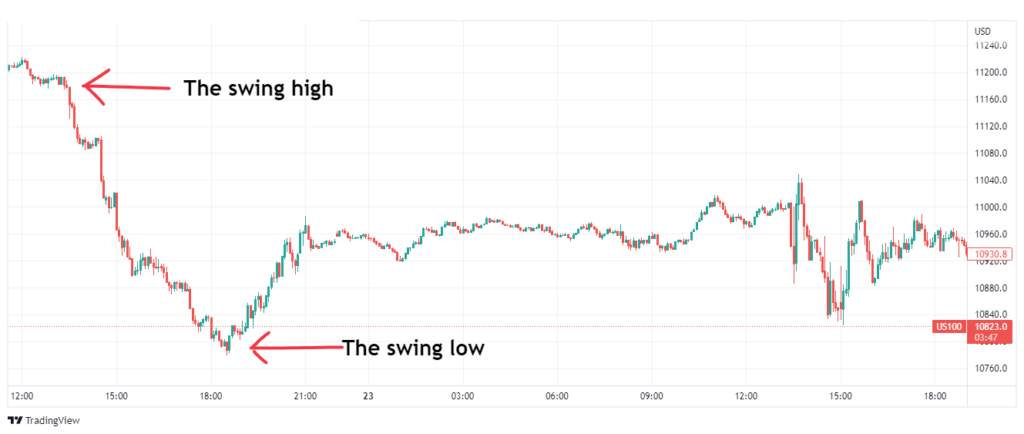
2-Find the swing high and swing low:

In order to draw a Fibonacci retracement, you will need to identify the swing high and swing low on the chart. The swing high is the highest point reached by the price during the current trend, and the swing low is the lowest point reached by the price during the current trend.
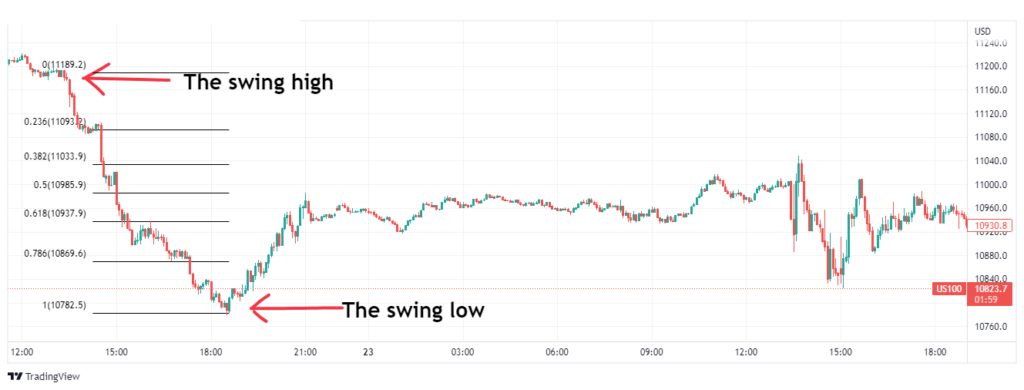
3-Draw the Fibonacci sequence retracement:

Once you have identified the swing high and swing low, you can draw the Fibonacci retracement by selecting the Fibonacci tool in your trading platform and clicking on the swing low, dragging the cursor to the swing high, and releasing the mouse button. This will create horizontal lines at the 23.6%, 38.2%, 50%, 61.8%, and 78.6% levels.
4-Look for entry and exit points:
Once the Fibonacci retracement sequence is drawn, you can look for entry and exit points using a variety of techniques. Some traders will enter the market when the price reaches a key Fibonacci level, while others may wait for a confirmation of the trend by looking for a price action pattern or indicator signal.
It’s important to note that the Fibonacci strategy is just one tool in a trader’s toolkit, and it should be used in conjunction with other technical and fundamental analysis techniques. It’s also important to remember that past performance is no guarantee of future results, and it’s always a good idea to use risk management techniques such as stop-loss orders to protect against potential losses.
You can us this strategy with the Mt4 Risk Management Indicator.
The Fibonacci sequence Calculator:
This Fibonacci calculator is a tool for calculating the Fibonacci sequence. Never again will you have to add the terms manually our calculator finds all Fibonacci sequence levels for you! You can also set your own starting values of the sequence and let this calculator do all the work for you.
CONCLUSION:
While the Fibonacci sequence can be a useful tool for traders, it is important to remember that it is just one of many tools available and should not be relied upon exclusively. It is important to consider other factors, such as market conditions and technical analysis, when making trading decisions.
Overall, the Fibonacci sequence is a valuable tool for forex traders looking to identify potential support and resistance levels in the market. By using Fibonacci retracement and extension levels, traders can make informed decisions and potentially increase their chances of success in the volatile world of forex trading.
.
