
Fibonacci Retracement for Maximizing Profits
Are you looking to enhance your trading skills and maximize your profits? Look no further than the art of trading with Fibonacci retracement techniques. In this article, we will explore how this powerful tool can help you identify potential market reversals and make accurate trading decisions.
Fibonacci retracement is a popular technical analysis tool used by experienced traders to determine key levels of support and resistance. It is based on the Fibonacci sequence, a mathematical pattern found in nature and the financial markets. By using specific ratios derived from this sequence, traders can identify areas where prices are likely to reverse and make profitable trades.
By mastering the art of trading with Fibonacci retracement techniques, you can gain an edge in the competitive world of trading. This article will provide a comprehensive overview of how this tool works and share practical tips on how to incorporate it into your trading strategy. Whether you are a beginner or an experienced trader, understanding and applying Fibonacci retracement techniques can significantly improve your trading results.
Join us as we delve into the fascinating world of Fibonacci retracement and discover how you can unlock its potential to maximize your profits in the financial markets.
Understanding Fibonacci Numbers and Ratios
Fibonacci numbers and ratios form the foundation of Fibonacci retracement techniques. The Fibonacci sequence is a series of numbers where each number is the sum of the two preceding ones. It starts with 0 and 1, and the sequence continues indefinitely. The ratio between consecutive numbers in the sequence is approximately 1.618, known as the golden ratio.
In trading, Fibonacci retracement levels are derived from these ratios, namely 23.6%, 38.2%, 50%, 61.8%, and 78.6%. These levels act as potential support and resistance areas in the market. Traders use these levels to identify price retracements within a larger trend and anticipate potential reversals.
Understanding the mathematical basis of Fibonacci retracement is essential for utilizing this tool effectively. By recognizing the significance of these ratios, you can pinpoint key levels in the market and make informed trading decisions.
How Fibonacci Retracement Levels are Used in Trading
Fibonacci retracement levels are used to identify areas of potential price reversals in trading. When a market is trending, price retracements often occur before the trend continues. These retracements can be measured using Fibonacci retracement levels, which act as support and resistance areas.
Traders use Fibonacci retracement levels in conjunction with other technical analysis tools to confirm potential reversals. By combining Fibonacci retracement with indicators such as moving averages or trend lines, traders can increase the probability of accurate trading signals.
To use Fibonacci retracement levels effectively, traders identify a significant swing high and a significant swing low in the market. They then draw Fibonacci retracement levels between these two points. The retracement levels act as reference points for potential support and resistance, helping traders determine where price is likely to reverse.
The Psychology Behind Fibonacci Retracement Levels
The effectiveness of Fibonacci retracement levels can be attributed to the psychology of market participants. Traders and investors often pay attention to these levels, leading to self-fulfilling prophecies. When a significant number of market participants place buy or sell orders near Fibonacci retracement levels, it creates a collective impact on the market.
This psychological phenomenon can result in price reversals or bounces near Fibonacci retracement levels. Traders who understand and utilize these levels can take advantage of the market psychology to make profitable trades.
Here’s an insight into the psychological aspects:
Recognition of Patterns: Traders are inclined to recognize and act upon patterns, including Fibonacci retracement levels, due to their historical significance and widespread use. This recognition creates self-fulfilling prophecies as traders anticipate reactions at these levels, leading to increased buying or selling pressure.
Herding Behavior: Market participants often exhibit herding behavior, where they follow the actions of others, especially in times of uncertainty. Fibonacci retracement levels serve as points of reference where many traders converge, amplifying their significance and impact on price movement.
Risk Management: Fibonacci retracement levels also influence traders’ risk management strategies. They may set stop-loss orders or take-profit levels near these levels, leading to clusters of orders at specific price points, reinforcing support or resistance levels indicated by Fibonacci ratios.
Market Sentiment: The placement of Fibonacci retracement levels reflects market sentiment. For example, during an uptrend, retracement levels signal potential buying opportunities as traders anticipate a continuation of the trend. Conversely, during a downtrend, retracement levels may act as resistance, reflecting pessimism among traders.
Psychological Levels: Fibonacci retracement levels often coincide with round psychological levels (e.g., 50%, 61.8%), which tend to attract attention from traders. These levels can trigger emotional responses, such as fear or greed, influencing trading decisions and contributing to price reversals or continuations.
Confirmation Bias: Traders may exhibit confirmation bias, seeking information that validates their existing beliefs or biases. When Fibonacci retracement levels align with other technical indicators or chart patterns, traders are more likely to perceive them as significant, reinforcing their trading decisions.
Liquidity Zones: Fibonacci retracement levels represent areas of potential liquidity, where buy and sell orders accumulate. Traders are aware of this liquidity concentration and aim to capitalize on price movements near these levels, contributing to their effectiveness as support or resistance zones.
In essence, the psychological significance of Fibonacci retracement levels stems from traders’ collective behavior, including their tendency to recognize patterns, exhibit herding behavior, manage risk, interpret market sentiment, succumb to psychological levels, exhibit confirmation bias, and capitalize on liquidity zones. Understanding these psychological factors can provide insights into market dynamics and enhance trading strategies.
Identifying Key Support and Resistance Levels Using Fibonacci Retracement
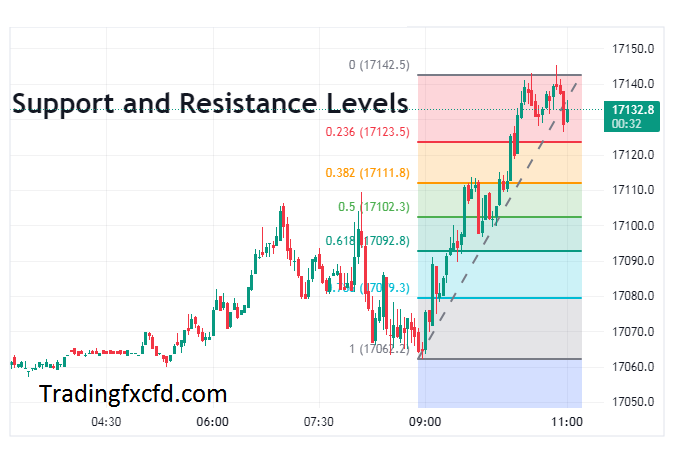
Fibonacci retracement levels help traders identify key support and resistance levels in the market. When a market is trending, price retracements often find support or encounter resistance near these levels. By recognizing these levels, traders can make more informed decisions about entering or exiting trades.
The 38.2% and 61.8% Fibonacci retracement levels are particularly significant in trading. The 38.2% level is often considered a shallow retracement, indicating a strong trend. Traders may look for opportunities to enter trades near this level, expecting the trend to continue.
On the other hand, the 61.8% level is considered a deep retracement, suggesting a potential reversal. Traders may watch for price action signals or other technical indicators to confirm a reversal near this level.
By identifying key support and resistance levels using Fibonacci retracement, traders can anticipate potential market movements and adjust their trading strategies accordingly.
Using Fibonacci Extension Levels to Set Profit Targets

In addition to retracement levels, Fibonacci extension levels can be used to set profit targets in trading. While retracement levels help identify potential entry and exit points, extension levels assist traders in determining where to take profits.
Fibonacci extension levels are derived from the same ratios used in retracement levels, namely 23.6%, 38.2%, 50%, 61.8%, and 78.6%. These levels act as potential profit-taking areas in the market.
Traders can set profit targets by drawing Fibonacci extension levels from a significant swing high to a significant swing low. These levels indicate where price is likely to reach after a trend resumes. By setting profit targets based on Fibonacci extension levels, traders can lock in profits and maximize their returns.
It is important to note that Fibonacci extension levels should be used in conjunction with other technical analysis tools and risk management strategies. Traders should consider market conditions, trend strength, and other factors before setting profit targets using Fibonacci extensions.
Combining Fibonacci Retracement with Other Technical Analysis Tools
While Fibonacci retracement is a powerful tool on its own, combining it with other technical analysis tools can enhance its effectiveness. Traders often use Fibonacci retracement in conjunction with indicators such as moving averages, trend lines, or oscillators to confirm potential reversals or trends.
For example, traders may look for Fibonacci retracement levels that align with a moving average or a trend line. When multiple indicators converge at the same level, it increases the probability of a significant price reversal.
those are some indicators and levels that you can use in combine with Fibonacci Retracement :
- Moving Averages:
- Use moving averages to confirm the direction of the trend identified by Fibonacci retracement.
- For example, in an uptrend, look for retracement levels to align with moving average support for potential entry points.
- Trendlines:
- Draw trendlines to identify the overall trend direction.
- Look for confluence between Fibonacci retracement levels and trendlines for stronger support or resistance areas.
- Relative Strength Index (RSI):
- Use RSI to identify overbought or oversold conditions.
- Look for divergence or convergence between RSI and price action at Fibonacci retracement levels for potential reversal signals.
- Candlestick Patterns:
- Watch for bullish or bearish candlestick patterns forming at Fibonacci retracement levels.
- Patterns like bullish engulfing or hammer candles near Fibonacci support, and bearish engulfing or shooting star candles near Fibonacci resistance can provide additional confirmation.
- Volume Analysis:
- Analyze volume levels at Fibonacci retracement levels.
- Higher volume at key retracement levels can signify strong support or resistance and validate the significance of those levels.
- Fibonacci Extensions:
- Consider Fibonacci extension levels in addition to retracement levels.
- Extension levels can provide potential profit targets beyond the initial retracement levels, offering a comprehensive trading plan.
- Chart Patterns:
- Look for chart patterns such as triangles, flags, or head and shoulders formations that coincide with Fibonacci retracement levels.
- Patterns forming near these levels can provide additional confirmation for potential breakout or reversal opportunities.
- Market Sentiment Indicators:
- Monitor market sentiment indicators like the Fear and Greed Index or sentiment surveys.
- Sentiment extremes combined with Fibonacci retracement levels can indicate potential turning points in the market.
- Support and Resistance Zones:
- Identify key support and resistance zones based on historical price levels.
- Look for confluence between these zones and Fibonacci retracement levels for stronger confirmation of potential reversal or continuation areas.
Common Mistakes to Avoid When Using Fibonacci Retracement Techniques
While Fibonacci retracement techniques can be powerful tools in trading, there are common mistakes that traders should avoid to maximize their effectiveness.
One common mistake is relying solely on Fibonacci retracement levels without considering other factors such as market conditions or fundamental analysis. It is important to use Fibonacci retracement in conjunction with other technical analysis tools and to consider the broader context in which it is applied.
Another mistake is using subjective interpretations of Fibonacci retracement levels. Traders should use objective criteria to identify swing highs and swing lows and draw Fibonacci retracement levels accordingly. Subjective interpretations can lead to biased analysis and inaccurate trading decisions.
Lastly, it is crucial to manage risk when using Fibonacci retracement techniques. Traders should set appropriate stop-loss orders and position sizes to protect their capital. Risk management should always be a priority to ensure long-term success in trading.
By avoiding these common mistakes, traders can harness the full potential of Fibonacci retracement techniques and improve their trading results.
Real-Life Examples of Successful Trades Using Fibonacci Retracement
To illustrate the effectiveness of Fibonacci retracement techniques, let’s explore some real-life examples of successful trades.
Example of an Uptrend:
In a bullish market, a trader identifies a significant swing low and a subsequent swing high. By drawing Fibonacci retracement levels between these two points, the trader can identify potential support levels for price retracements. When price retraces to the 38.2% or 61.8% retracement level and shows signs of a reversal, the trader enters a long position. As price bounces off the retracement level and resumes its uptrend, the trader can exit the trade near a Fibonacci extension level, locking in profits.
Example of a Downtrend:
In a bearish market, the same principles apply. A trader identifies a significant swing high and a subsequent swing low, drawing Fibonacci retracement levels between these points. When price retraces to the 38.2% or 61.8% retracement level and shows signs of a reversal, the trader enters a short position. As price bounces off the retracement level and continues its downtrend, the trader can exit the trade near a Fibonacci extension level, maximizing their profits.
These examples demonstrate how Fibonacci retracement techniques can be applied in different market conditions to make successful trades. By understanding the principles behind Fibonacci retracement and combining it with other technical analysis tools, traders can increase their chances of profitable trading.
Conclusion: Incorporating Fibonacci Retracement Techniques into Your Trading Strategy
Incorporating Fibonacci retracement techniques into your trading strategy can provide a valuable edge in the financial markets. By understanding and applying these techniques, you can identify potential market reversals, set accurate profit targets, and make more informed trading decisions.
Remember to combine Fibonacci retracement with other technical analysis tools to confirm potential reversals or trends. Avoid common mistakes such as relying solely on Fibonacci retracement levels or using subjective interpretations. Always prioritize risk management to protect your capital and ensure long-term success.
Mastering the art of trading with Fibonacci retracement techniques takes time and practice. Start by familiarizing yourself with the mathematical basis of Fibonacci numbers and ratios. Then, learn how to apply Fibonacci retracement levels to identify key support and resistance areas. Finally, experiment with different combinations of Fibonacci retracement and other technical analysis tools to find a trading strategy that works for you.
Unlock the potential of Fibonacci retracement and maximize your profits in the financial markets. By incorporating this powerful tool into your trading strategy, you can gain an edge and achieve consistent trading success. Happy trading!