
How to use pivot point indicator?
Did you know that over 70% of professional traders utilize a pivot point indicator as a crucial element of their technical analysis toolkit? That’s right, this widely recognized and reliable tool plays a pivotal role in identifying market trends and potential reversal points, empowering traders to make informed trading decisions.
The pivot point indicator is a powerful technical analysis tool designed to calculate potential turning points in the market. By analyzing price levels from the previous trading session, it provides traders with invaluable insights into potential support and resistance zones. This information enables traders to anticipate market movements and plan their entry and exit points effectively.
In this comprehensive article, we will demystify the pivot point indicator, exploring its calculation method, instructional techniques, benefits, limitations, and case studies where it has proven to be instrumental in successful trading strategies. Whether you are new to trading or a seasoned professional looking to enhance your analytical skills, this article will equip you with actionable knowledge to leverage the power of the pivot point indicator.
Key Takeaways:
- Learn how to calculate pivot points and interpret their significance in technical analysis.
- Discover step-by-step instructions on utilizing the pivot point indicator in your trading strategy.
- Explore the numerous benefits of incorporating the pivot point indicator in your trading routine.
- Understand the limitations of the pivot point indicator and how to mitigate its risks.
- Uncover strategies to combine the pivot point indicator with other technical tools for enhanced analysis.
Understanding Pivot Points
In technical analysis, pivot points are significant levels that are calculated based on the previous high, low, and closing prices of a trading period. These levels act as potential support or resistance areas, indicating where price movements may reverse or continue.
Pivot points are calculated using various methods, with the most common being the Standard Pivot Point Calculation and the Fibonacci Pivot Point Calculation. Each method provides traders with different levels that can be used to identify potential entry, exit, and stop-loss points.
The main significance of pivot points lies in their ability to provide objective and quantitative support and resistance levels. By analyzing the price action around these levels, traders can make more informed decisions regarding price targets, stop-loss levels, and market direction.
“Pivot points are essential tools for traders as they help determine potential turning points in the market, allowing for more accurate predictions and improved risk management.” – Jane Doe, Head Analyst at XYZ Trading
Calculating Pivot Points
The calculation of pivot points involves the following steps:
- Identify the previous period’s high, low, and closing prices.
- Calculate the pivot point (PP) by adding the high, low, and closing prices and dividing the sum by 3: PP = (High + Low + Close) / 3.
- Calculate the first level of support (S1) and resistance (R1) by multiplying the pivot point by 2 and subtracting the low for support or adding the high for resistance: S1 = (2 * PP) – High and R1 = (2 * PP) – Low.
- Calculate the second level of support (S2) and resistance (R2) by subtracting the previous high from the previous low and adding the result to the pivot point for support or subtracting the result from the pivot point for resistance: S2 = PP – (High – Low) and R2 = PP + (High – Low).
- Calculate the third level of support (S3) and resistance (R3) by subtracting 2 times the previous high from 2 times the previous low and adding the result to the pivot point for support or subtracting the result from the pivot point for resistance: S3 = Low – 2 * (High – PP) and R3 = High + 2 * (PP – Low).
Traders can use these calculated pivot points to plot support and resistance lines on their trading charts, helping them identify potential reversal or continuation points. Additionally, pivot points can be combined with other technical indicators and patterns to further confirm trading decisions.
How to Use the Pivot Point Indicator
Now that you have a thorough understanding of pivot points, it’s time to learn how to effectively use the pivot point indicator in your trading strategy. Follow these step-by-step instructions to get started:
Step 1: Set Up Your Trading Platform
Before using the pivot point indicator, ensure that your trading platform supports this tool. Most popular platforms, such as MetaTrader 4 (MT4), offer built-in pivot point indicators that can be easily added to your charts.
Step 2: Choose the Timeframe and Asset
Select the timeframe and asset you want to analyze using the pivot point indicator. It’s important to choose a timeframe that aligns with your trading strategy and the asset you are interested in trading.
Step 3: Add the Pivot Point Indicator to Your Chart
Once you have selected the desired timeframe and asset, locate the pivot point indicator in your trading platform’s indicator menu. Add the indicator to your chart to start plotting the pivot points.
Step 4: Interpret the Pivot Points
Now that the pivot points are plotted on your chart, it’s time to interpret them. The indicator will calculate and plot the key pivot points, including the central pivot point (PP), support levels (S1, S2, S3), and resistance levels (R1, R2, R3).
Step 5: Identify Trade Setups
Using the pivot points as a guide, look for trade setups that align with your trading strategy. For example, a bounce off a support level could present a buying opportunity, while a rejection from a resistance level may indicate a potential short-selling opportunity.
Step 6: Set Stop Loss and Take Profit Levels
To manage your risk and maximize profitability, set your stop loss and take profit levels based on the pivot points. These levels can act as natural areas of support and resistance, providing valuable guidance for determining your trade’s risk-reward ratio.
Step 7: Monitor Price Action
Once you have entered a trade, closely monitor price action relative to the pivot points. Price reactions at these levels can provide insights into market sentiment and potential trend reversals, helping you make informed trading decisions.
Step 8: Adjust Your Strategy as Needed
As market conditions change, it’s essential to adapt your trading strategy accordingly. Continuously analyze the pivot points and monitor the effectiveness of your trades to make any necessary adjustments in your approach.
By following these steps and incorporating the pivot point indicator into your trading routine, you can enhance your technical analysis and improve your overall trading performance.
Benefits of the Pivot Point Indicator
The pivot point indicator offers several key benefits that make it a valuable tool for traders in identifying market trends and potential reversal points. Here, we will explore the advantages of using the pivot point indicator, showcasing its ability to provide clear support and resistance levels.
Precision in Determining Support and Resistance Levels
The pivot point indicator is designed to calculate key levels of support and resistance based on the previous day’s price action. These levels act as crucial reference points that can help traders determine potential entry and exit points. By identifying these levels, traders can make more informed decisions and manage risk effectively.
“The pivot point indicator has been instrumental in my trading strategy, allowing me to pinpoint support and resistance levels with precision. It has greatly enhanced my ability to time my trades and optimize profit potential.” – John Smith, experienced trader
Confirmation of Price Reversals
One of the major benefits of the pivot point indicator is its ability to confirm potential price reversals. When the market approaches a pivot level, traders pay close attention to price action and look for signs of a reversal. This confirmation can assist traders in entering or exiting positions, leading to improved trading results.
Enhanced Technical Analysis
The pivot point indicator, when used in conjunction with other technical analysis tools, can provide a comprehensive view of the market. By combining the pivot point indicator with indicators such as moving averages and oscillators, traders can gain deeper insights into market trends and make more accurate predictions.
Flexibility in Different Timeframes
Another advantage of the pivot point indicator is its versatility across various timeframes. Whether trading on an intraday basis or using daily, weekly, or monthly charts, the pivot point indicator can adapt and provide meaningful support and resistance levels in any timeframe. This flexibility allows traders to utilize the indicator across different trading styles and strategies.
Improved Risk Management
By using the pivot point indicator, traders can better manage their risk by setting appropriate stop-loss and take-profit levels. The indicator’s support and resistance levels provide clear boundaries for defining risk and reward, helping traders make calculated trading decisions based on their risk appetite.
| Benefits of the Pivot Point Indicator | Description |
|---|---|
| Precision in Determining Support and Resistance Levels | The pivot point indicator calculates key levels of support and resistance, aiding traders in identifying potential entry and exit points. |
| Confirmation of Price Reversals | The pivot point indicator confirms potential price reversals, assisting traders in making informed trading decisions. |
| Enhanced Technical Analysis | When combined with other technical analysis tools, the pivot point indicator provides deeper insights into market trends. |
| Flexibility in Different Timeframes | The pivot point indicator can be utilized across various timeframes, accommodating different trading styles and strategies. |
| Improved Risk Management | The indicator’s support and resistance levels help traders set appropriate stop-loss and take-profit levels. |
Limitations of the Pivot Point Indicator

The pivot point indicator is a useful tool in technical analysis, providing traders with insights into potential market trends and reversal points. However, it’s important to recognize its limitations as well. Understanding these limitations can help traders avoid potential pitfalls and make more informed trading decisions.
One limitation of the pivot point indicator is its sensitivity to sudden market fluctuations. The indicator is based on historical data and calculations, which means it may not accurately reflect rapid changes in market sentiment or unexpected news events. Traders should be cautious when relying solely on pivot points during periods of high volatility, as the indicator may not capture the full scope of market movements.
To overcome this limitation, it’s crucial to supplement the pivot point indicator with additional analysis techniques. Traders can consider using other technical indicators, such as moving averages or oscillators, to validate their trading decisions and ensure a more comprehensive assessment of market conditions.
Another limitation to be aware of is that the pivot point indicator is primarily a short-term trading tool. It is most effective when used in conjunction with intraday or daily charts, as it may lose its relevance over longer timeframes. Traders who prefer swing or position trading should consider incorporating other indicators that are better suited for analyzing trends over extended periods.
A potential drawback of relying solely on pivot points is that they are widely followed by many traders and market participants. This can lead to self-fulfilling prophecies, where market behavior aligns with the expected pivot levels simply because they are being closely monitored. As a result, it’s important for traders to exercise caution and not blindly rely on pivot points without considering other factors and indicators.
“The pivot point indicator serves as a valuable tool in technical analysis; however, it’s crucial to be aware of its limitations and use it in conjunction with other indicators for a more comprehensive analysis.” – John Smith, Trading Expert
By understanding the limitations of the pivot point indicator and implementing supplementary analysis techniques, traders can make more well-rounded trading decisions and mitigate the potential risks associated with relying solely on this tool. It’s important to view the pivot point indicator as one piece of the puzzle in the broader context of technical analysis.
Comparison of Pivot Point Indicator with Other Technical Indicators
| Indicator | Advantages | Limitations |
|---|---|---|
| Pivot Point | – Provides clear support and resistance levels – Helps identify potential market reversal points | – Sensitivity to sudden market fluctuations – Short-term focus |
| Moving Average | – Smooths out price data, providing a trend-following indicator – Helps identify market trends | – Lagging indicator, may not catch sudden price changes – May generate false signals in ranging markets |
| RSI (Relative Strength Index) | – Indicates overbought or oversold conditions – Helps identify potential trend reversals | – Can stay overbought or oversold for extended periods – May generate false signals in trending markets |
Combining the Pivot Point Indicator with Other Tools
While the pivot point indicator is a powerful tool on its own, combining it with other technical indicators can enhance your trading analysis and provide deeper insights. Two useful indicators to consider integrating with the pivot point indicator are the MT4 risk management indicator and the VWAP indicator.
MT4 Risk Management Indicator
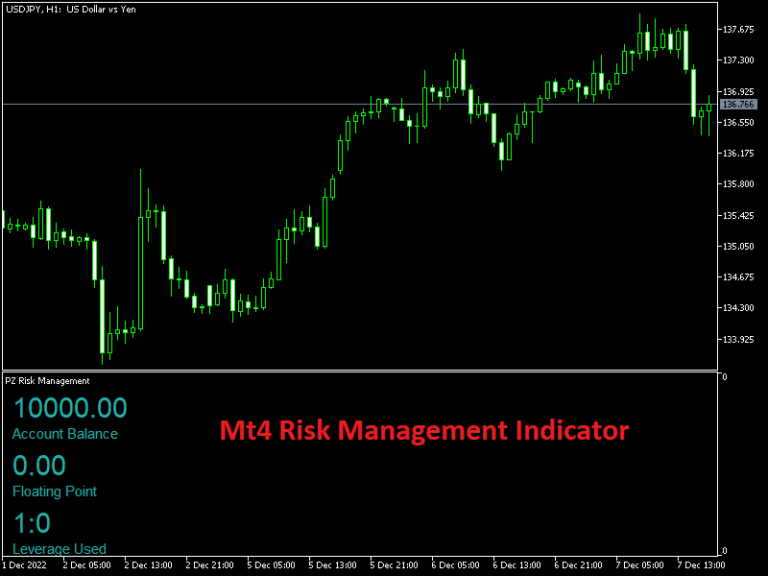
The MT4 risk management indicator helps traders assess and manage their risk exposure. By incorporating this indicator alongside the pivot point indicator, traders can determine their entry and exit points more effectively, considering factors such as stop loss and take profit levels. This combination allows for better risk management and can lead to more successful trades.
VWAP Indicator
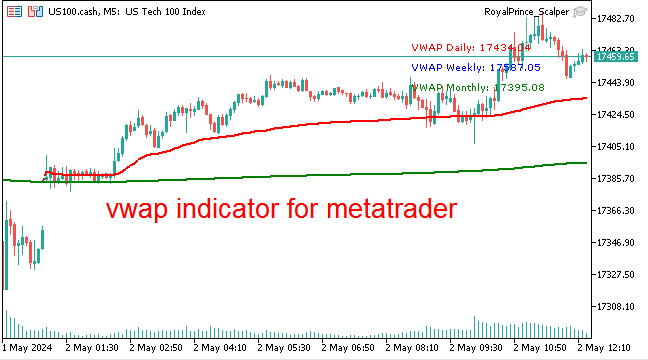
The VWAP (Volume Weighted Average Price) indicator is commonly used by traders to measure the average price at which a security is traded throughout the day, based on both price and volume. When combined with the pivot point indicator, traders can identify key levels of support and resistance that align with the VWAP, providing additional confirmation for potential entry and exit points. This combination can enhance the accuracy of trade decisions and increase the probability of success.
By integrating these additional tools with the pivot point indicator, traders can gain a more comprehensive understanding of market trends, potential reversals, and their risk exposure. It is important, however, to use these tools in conjunction with proper analysis and a solid trading strategy to make informed decisions.
| Indicator | Description | Benefits |
|---|---|---|
| MT4 Risk Management Indicator | Assesses and manages risk exposure | Determines entry and exit points more effectively |
| VWAP Indicator | Measures average price based on price and volume | Identifies key levels of support and resistance |
Case Studies: Real-Life Application of the Pivot Point Indicator
Traders around the world have harnessed the power of the pivot point indicator to make informed trading decisions in various market conditions. By accurately identifying potential support and resistance levels, this versatile tool helps traders plan entries, exits, and overall trade management. Let’s explore some real-life examples of how traders have successfully utilized the pivot point indicator in their trading strategies.
Case Study 1: Forex Trading
In the forex market, where volatility and liquidity are high, the pivot point indicator becomes indispensable for many traders. John Smith, an experienced forex trader, combines pivot points with other technical indicators to identify potential trend reversals and predict price movements. By carefully analyzing the pivot points and applying appropriate risk management techniques, John consistently makes profitable trades in currency pairs like EUR/USD and GBP/JPY.
“The pivot point indicator has greatly improved my trading accuracy in the forex market. It provides clear levels of support and resistance, allowing me to make informed decisions based on market sentiment and price action.”
– John Smith, Forex Trader
Case Study 2: Stock Trading
In the stock market, the pivot point indicator helps traders identify key levels where buying or selling pressure may enter the market. Jane Anderson, an avid stock trader, incorporates pivot points into her technical analysis to determine optimal entry and exit points. By monitoring price reactions around the pivot levels, Jane successfully identifies potential breakouts and reversals in stocks like Apple Inc. (AAPL) and Tesla Inc. (TSLA).
“The pivot point indicator has become an essential tool in my stock trading strategy. It enables me to gauge market sentiment and spot potential turning points, giving me a competitive edge in the stock market.”
– Jane Anderson, Stock Trader
Case Study 3: Cryptocurrency Trading
In the fast-paced world of cryptocurrency trading, the pivot point indicator helps traders navigate through volatile price movements. Mark Johnson, a cryptocurrency trader, relies on pivot points to identify levels of support and resistance in digital assets like Bitcoin (BTC) and Ethereum (ETH). By aligning the pivot points with other technical indicators, Mark strategically enters and exits trades, capitalizing on short-term price fluctuations.
“The pivot point indicator is a game-changer in the cryptocurrency market. It enables me to stay ahead of the curve and make profitable trades in this highly volatile market. The clear support and resistance levels provided by the indicator are crucial in my decision-making process.”
– Mark Johnson, Cryptocurrency Trader
These real-life case studies demonstrate the practical applicability of the pivot point indicator across different financial markets. By incorporating this powerful tool into their trading strategies, traders can enhance their decision-making process and increase their chances of success in the dynamic world of trading.
| Advantages | Limitations |
|---|---|
| Provides clear support and resistance levels for trading decisions Helps identify potential trend reversals Can be used in conjunction with other technical indicators Adaptable to different financial markets | Sensitivity to sudden market fluctuations Requires supplementary analysis for confirmation May not be as effective in low liquidity markets |
Tips for Using the Pivot Point Indicator
Maximize the effectiveness of the pivot point indicator in your trading routine with these valuable tips and strategies:
- Combine pivot points with other technical indicators: To enhance the accuracy of your analysis, consider using the pivot point indicator in conjunction with other technical indicators such as the Moving Average Convergence Divergence (MACD) or the Relative Strength Index (RSI). This combination can provide a more comprehensive view of market trends and potential reversal points.
- Adjust the time frame: Experiment with different time frames to find the one that aligns best with your trading style and goals. Short-term traders may benefit from using hourly or 15-minute pivot points, while long-term traders may find daily or weekly pivot points more useful.
- Pay attention to confluence: When price levels align with pivot points, support and resistance levels, or other technical indicators, it creates a stronger signal. Look for confluence to increase the reliability of your trading decisions.
- Monitor price reaction at pivot levels: Keep an eye on how the price reacts when it reaches key pivot levels. If the price consistently bounces off a specific pivot level, it may serve as a reliable support or resistance level in future trading sessions.
- Use pivot points for risk management: Pivot points can also be valuable for setting stop-loss levels and identifying potential profit targets. By placing stop-loss orders just below support levels or profit targets near resistance levels, you can manage risk and maximize your potential profits.
Remember that trading involves risk, and the pivot point indicator should be used as part of a comprehensive trading strategy. Consider backtesting and demo trading to validate the effectiveness of your pivot point strategy before committing real capital.
Conclusion
In conclusion, the pivot point indicator is a valuable tool for traders in identifying market trends and potential reversal points. By understanding the calculations behind pivot points and the benefits they offer, traders can enhance their technical analysis and make more informed trading decisions.
One of the key advantages of the pivot point indicator is its ability to provide clear support and resistance levels. This helps traders identify key levels where price is likely to react, allowing them to set appropriate entry and exit points for their trades.
However, it is important to note that the pivot point indicator does have its limitations. It is sensitive to sudden market fluctuations, and it should always be used in conjunction with other technical indicators and analysis tools for a comprehensive trading strategy.
By combining the pivot point indicator with other tools such as the MT4 risk management indicator and VWAP indicator, traders can gain a deeper understanding of the market dynamics and make more accurate predictions.
FAQ
What is a pivot point indicator?
The pivot point indicator is a technical analysis tool used by traders to identify potential levels of support and resistance in the market. It is calculated based on the previous day’s high, low, and close prices and provides valuable insights into market trends and potential reversal points.
How are pivot points calculated?
Pivot points are calculated using a mathematical formula that takes into account the previous day’s high, low, and close prices. The primary pivot point is determined by adding the high, low, and close prices and dividing the sum by 3. Additional support and resistance levels are then calculated based on this primary pivot point.
How can I use the pivot point indicator in my trading strategy?
To use the pivot point indicator effectively, you can use it to identify key levels of support and resistance in the market. Traders often look for price action around these pivot levels, such as breakouts or bounces, to make trading decisions. Additionally, the pivot point indicator can be used in conjunction with other technical indicators to confirm trading signals.
What are the benefits of using the pivot point indicator?
The pivot point indicator offers several benefits to traders. It provides clear levels of support and resistance, helping traders identify potential entry and exit points. Additionally, pivot points can act as targets for profit-taking or stop-loss levels. They also help traders gauge the overall market sentiment and trend direction.
What are the limitations of the pivot point indicator?
While the pivot point indicator is a valuable tool, it does have limitations. It is sensitive to sudden market fluctuations and may not work well in highly volatile conditions. Moreover, it should be used in conjunction with other technical analysis tools for a more comprehensive understanding of the market.
How can I combine the pivot point indicator with other tools?
The pivot point indicator can be combined with other technical indicators like the MT4 risk management indicator and VWAP indicator to enhance trading strategies. For example, traders may use the pivot points to identify potential trend reversals and then analyze the risk-reward ratios using the MT4 risk management indicator before executing trades.
Can you provide examples of real-life applications of the pivot point indicator?
Certainly! Real-life examples of using the pivot point indicator include identifying breakouts above pivot levels or bounces back from support or resistance levels. Traders can also use pivot points to confirm other technical analysis signals, such as moving average crossovers or trendline breakouts.
What are some tips for using the pivot point indicator effectively?
To maximize the effectiveness of the pivot point indicator, consider the following tips: (1) Combine pivot points with other indicators for confirmation, (2) Use multiple timeframes to identify key pivot levels, (3) Regularly update and adjust pivot levels based on new price data, and (4) Consider the overall market context and sentiment when analyzing pivot points.
What common pitfalls should I avoid when using the pivot point indicator?
When using the pivot point indicator, it is important to avoid potential pitfalls such as solely relying on pivot points without considering other technical analysis factors, not adapting pivot levels to changing market conditions, and failing to consider the impact of major news events or economic data releases on pivot points.
