
The Market Profile Indicator
Explanation of Market Profile Indicator
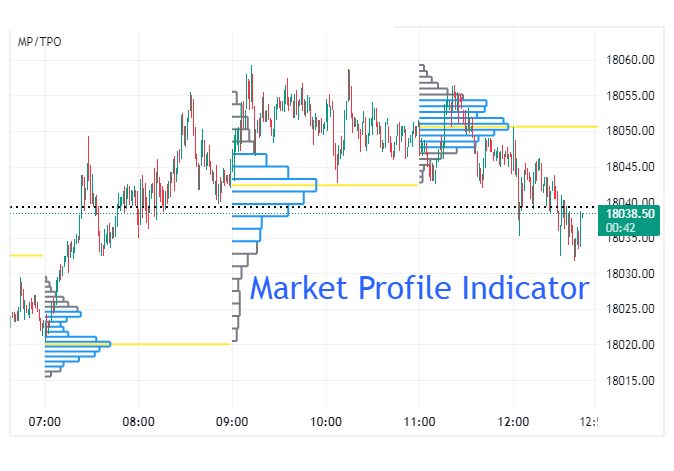
The Market Profile Indicator is a tool used by traders to analyze the market’s price action over a specified period, typically one trading day. It organizes price data into a graphical representation that helps traders identify key levels of support and resistance, gauge market sentiment, and anticipate potential price movements.
At its core, Market Profile focuses on three main components: time, price, and volume. It divides the trading session into segments based on time intervals (e.g., 30 minutes, 1 hour) and then plots the volume traded at each price level within those intervals. This creates a profile or histogram of the distribution of trading activity throughout the session.
The key elements of Market Profile include:
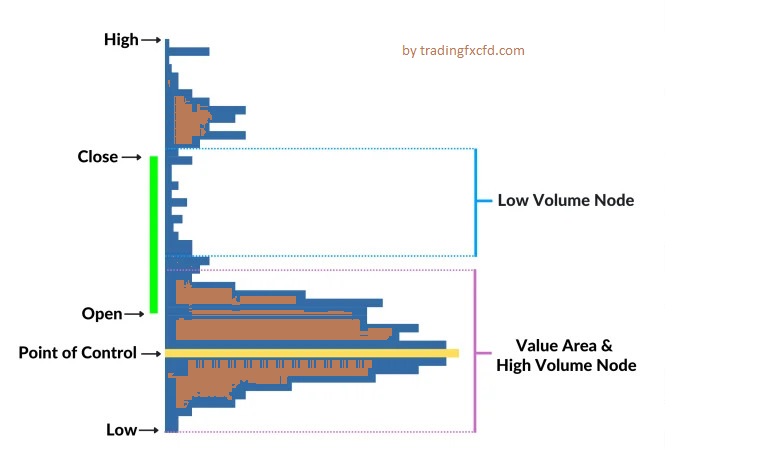
- Value Area: This is the price range where the majority of trading activity occurred during the specified period. It is typically divided into two parts: the Value Area High (VAH) and the Value Area Low (VAL). The Value Area represents a range of prices where there was equilibrium between buyers and sellers.
- Point of Control (POC): This is the price level at which the most trading volume occurred during the session. It is often considered a significant reference point as it represents the price where the market found the most balance between supply and demand.
- Initial Balance: This refers to the price range within which the market established its first significant trading range at the beginning of the session. It provides insights into early market sentiment and potential trading ranges for the rest of the session.
- Time Price Opportunity (TPO) Chart: Instead of plotting price against time like traditional candlestick or bar charts, Market Profile uses TPO charts, which display price levels on the vertical axis and time intervals on the horizontal axis. This helps traders visualize where the majority of trading activity occurred at different price levels throughout the session.
Traders use Market Profile to gain a deeper understanding of market dynamics and identify trading opportunities. By analyzing the distribution of volume and price over time, traders can discern areas of support and resistance, anticipate potential breakouts or reversals, and make more informed trading decisions. Overall, the Market Profile Indicator provides traders with a comprehensive view of market activity and can be a valuable tool for enhancing their trading strategies.
Importance and relevance in trading
The Market Profile Indicator holds significant importance and relevance in trading for several reasons:
- Understanding Market Structure: Market Profile provides traders with a structured way to analyze the market, helping them understand the underlying dynamics of price movement. By visualizing the distribution of volume and price over time, traders can identify key levels of support and resistance, as well as areas of high trading activity.
- Identifying Key Price Levels: Market Profile helps traders identify important price levels such as the Point of Control (POC), Value Area High (VAH), and Value Area Low (VAL). These levels serve as reference points for traders to base their trading decisions on, as they represent areas where significant trading activity has occurred.
- Gauging Market Sentiment: The shape of the Market Profile can provide insights into market sentiment. For example, a narrow profile with a well-defined Value Area may indicate a balanced market, while a wide profile with multiple distributions may suggest increased volatility and uncertainty.
- Anticipating Price Movements: By analyzing how price behaves around key Market Profile levels, traders can anticipate potential price movements. For instance, if price repeatedly fails to move beyond the Value Area High, it may suggest that buyers are struggling to push the price higher, potentially leading to a reversal.
- Risk Management: Market Profile can also help traders manage risk more effectively by providing clear levels for placing stop-loss orders. By identifying areas of support and resistance, traders can place stop-loss orders outside these levels to limit potentials losses.
- Confirmation Tool: Market Profile can be used in conjunction with other technical analysis tools to confirm trading signals. For example, if a candlestick pattern forms near a key Market Profile level, it may provide additional confirmation for a potential trade setup.
- Adaptability Across Markets: Market Profile can be applied to various markets, including stocks, futures, forex, and commodities. Its principles remain consistent across different instruments, making it a versatile tool for traders in different markets.
In summary, the Market Profile Indicator is an important tool for traders as it provides a structured way to analyze market dynamics, identify key price levels, gauge market sentiment, anticipate price movements, manage risk, and confirm trading signals. By incorporating Market Profile into their trading strategies, traders can make more informed decisions and improve their overall trading performance.
Components of Market Profile
The Market Profile indicator consists of several key components that help traders analyze and understand market dynamics. These components include:
- Time Price Opportunity (TPO) Chart: The TPO chart is the primary graphical representation used in Market Profile. It displays price levels on the vertical axis and time intervals on the horizontal axis. Each vertical bar, or “TPO,” represents the trading activity that occurred at a specific price level during a particular time period. TPOs are often color-coded to indicate whether price traded above or below the previous period’s value.
- Value Area: The Value Area is a price range where the majority of trading activity occurred during a specified period, typically one trading day. It is calculated based on a certain level of statistical significance, often encompassing around 70-80% of the total volume traded during the session. The Value Area is divided into two parts: the Value Area High (VAH) and the Value Area Low (VAL).
- Point of Control (POC): The Point of Control represents the price level at which the most trading volume occurred during the session. It is often considered a significant reference point as it indicates where the market found the most balance between buyers and sellers. The POC can serve as a potential support or resistance level, depending on its location relative to the current price.
- Initial Balance: The Initial Balance refers to the price range within which the market established its first significant trading range at the beginning of the session. It provides insights into early market sentiment and helps traders identify the initial trading range for the day. The Initial Balance can serve as a reference point for assessing subsequent price movements and trading opportunities.
- Developing and Composite Profiles: Developing Profile refers to the Market Profile formed during the current trading session, while Composite Profile refers to the aggregation of multiple Market Profiles over a specified period, such as weeks or months. Both Developing and Composite Profiles provide valuable insights into longer-term market trends, patterns, and key price levels.
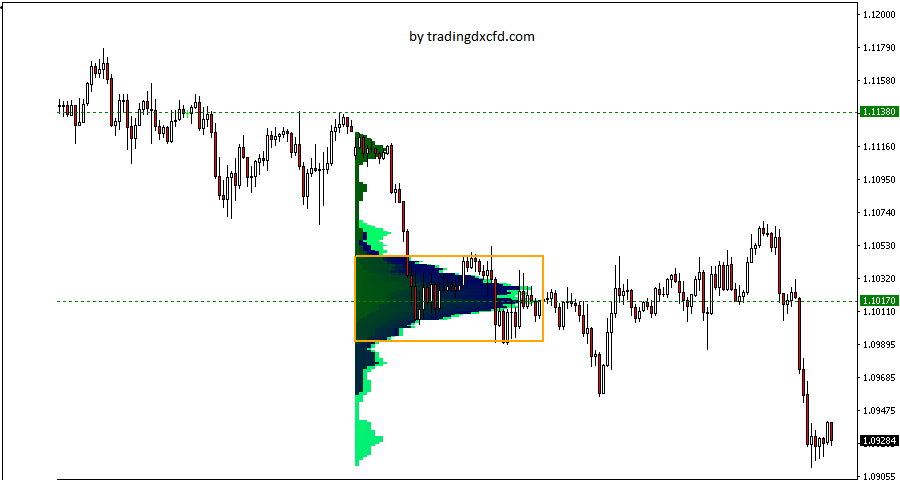
- Volume Profile: While Market Profile primarily focuses on price distribution, Volume Profile complements it by displaying the volume traded at each price level. Volume Profile helps traders identify areas of high and low trading activity, as well as potential support and resistance levels based on volume clusters.
By understanding and analyzing these components of Market Profile, traders can gain valuable insights into market dynamics, identify key price levels, gauge market sentiment, and make more informed trading decisions.
How Market Profile differs from traditional technical indicators
Market Profile differs from traditional technical indicators in several key ways:
- Focus on Price Distribution: Market Profile primarily focuses on analyzing the distribution of price and volume over time. It organizes price data into a graphical representation that helps traders identify key levels of support and resistance based on where the most trading activity occurs. In contrast, traditional technical indicators typically analyze price movement based on mathematical formulas or statistical calculations, such as moving averages, oscillators, or trend lines.
- Time-based vs. Price-based Analysis: Market Profile uses a time-based approach to analyze market activity, dividing the trading session into specific time intervals (e.g., 30 minutes, 1 hour) and plotting the volume traded at each price level within those intervals. This allows traders to visualize how price behaves over time and identify areas of high and low trading activity. Traditional technical indicators, on the other hand, focus primarily on price-based analysis, using historical price data to generate signals or patterns that indicate potential future price movements.
- Market Structure vs. Price Patterns: Market Profile helps traders understand the underlying market structure by identifying key levels of support and resistance, such as the Value Area, Point of Control (POC), and Initial Balance. These levels are derived from the distribution of volume and price over time and provide valuable insights into market sentiment and potential price movements. Traditional technical indicators, on the other hand, often focus on identifying specific price patterns or signals, such as trend reversals, breakouts, or overbought/oversold conditions, without necessarily considering the broader market context.
- Visual Representation: Market Profile provides traders with a visual representation of market activity through TPO (Time Price Opportunity) charts, histograms, and profiles. This visual approach allows traders to quickly and intuitively interpret market data and identify trading opportunities based on patterns and trends. Traditional technical indicators may also provide visual representations, but they often rely more heavily on numerical values or mathematical formulas to generate signals.
- Interpretation and Analysis: Market Profile requires a different interpretation and analysis compared to traditional technical indicators. Traders need to understand concepts such as Value Area, POC, and Initial Balance, as well as how to interpret the shape and structure of the Market Profile chart. While traditional technical indicators may also require interpretation, they often rely on predefined rules or parameters to generate signals, making them easier to apply for some traders.
Overall, while both Market Profile and traditional technical indicators aim to help traders analyze market dynamics and identify trading opportunities, they differ in their approach, focus, and interpretation. Market Profile provides a unique perspective on market activity by analyzing price distribution over time, whereas traditional technical indicators often focus more narrowly on specific price patterns or signals.
Market Profile Strategies
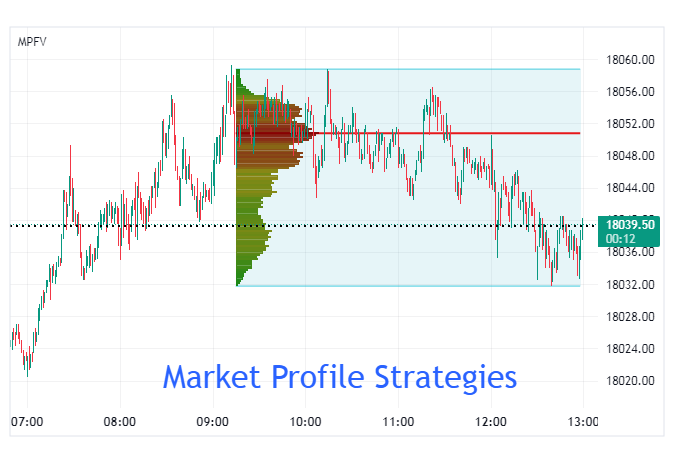
Market Profile strategies are designed to help traders identify trading opportunities based on the analysis of market structure, volume, and price distribution. Here are several strategies commonly used by traders:
- Trading the Initial Balance Breakout: This strategy involves waiting for the market to establish its initial trading range (Initial Balance) and then looking for a breakout or breakdown from this range. Traders may enter long positions if price breaks above the initial balance high or short positions if price breaks below the initial balance low. They often use volume confirmation to validate the breakout.
- Fade the Range Extension: When the market extends beyond the initial balance range, traders may look to fade the move by entering trades in the opposite direction, anticipating a retracement back into the initial balance range. This strategy relies on the principle of mean reversion, assuming that extended moves are often followed by pullbacks.
- Trading Value Area Rejections: Traders identify key levels within the Value Area, such as the Value Area High (VAH) and Value Area Low (VAL), and look for price rejections at these levels. If price fails to penetrate the VAH or VAL and reverses direction, traders may enter trades in the opposite direction, targeting a move back towards the POC or the opposing Value Area boundary.
- Trading the Point of Control (POC): Traders focus on the POC as a significant reference point for potential trading opportunities. They may enter trades in the direction of the trend if price approaches the POC and shows signs of holding as support or resistance. Alternatively, they may fade moves away from the POC, anticipating a reversion back towards it.
- Breakout and Retest of Value Area: This strategy involves waiting for price to break out of the Value Area and then retest it from the opposite side. Traders look for a successful retest where the previous resistance (if breaking out to the upside) turns into support, or vice versa. They then enter trades in the direction of the breakout, targeting further price movement in that direction.
- Trading Profile Shape: Traders analyze the overall shape of the Market Profile to identify trading opportunities. For example, a bimodal profile with two distinct peaks may indicate potential reversal points, while a narrow profile with a well-defined Value Area may suggest a period of consolidation and range-bound trading.
- Volume Confirmation: Traders use volume analysis to confirm trading signals generated by Market Profile analysis. High volume accompanying a breakout or breakdown adds conviction to the trade, while low volume may signal a lack of participation and potential reversal.
- Trend Following: While Market Profile is often associated with identifying reversals and range-bound conditions, traders can also use it to identify trends. Traders look for Market Profile characteristics such as elongated profiles or one-sided distributions to identify trending markets and enter trades in the direction of the trend.
It’s important for traders to adapt these strategies to their individual trading styles, risk tolerance, and market conditions. Additionally, traders should always practice proper risk management and consider incorporating stop-loss orders to protect against adverse price movements