
Best technical indicators for day trading
How to choose the best technical indicators for day trading ? in the fast-paced world of financial markets, day trading stands out as a dynamic and exhilarating endeavor. Unlike traditional investing, where positions are held for weeks or months, day trading involves executing trades within the same trading day, capitalizing on short-term price movements. However, navigating this high-intensity landscape requires more than just intuition; it demands a systematic approach grounded in technical analysis.
Technical indicators serve as the backbone of day trading strategies, offering traders valuable insights into market trends, momentum, volatility, and potential entry and exit points. By harnessing the power of these indicators, day traders can make informed decisions amid the chaos of the markets, seeking to capture profits swiftly and efficiently.
In this article, we delve into the world of day trading technical indicators, exploring the best tools at the disposal of traders looking to thrive in this competitive arena. From Moving Averages to Relative Strength Index (RSI), Moving Average Convergence Divergence (MACD), Bollinger Bands, and beyond, we’ll dissect each indicator’s mechanics, discuss their applications in day trading strategies, and provide practical tips for implementation.
Whether you’re a seasoned day trading veteran or a newcomer looking to embark on this exhilarating journey, this comprehensive guide will equip you with the knowledge and tools needed to navigate the markets with confidence and precision. So buckle up and prepare to unlock the secrets of successful day trading through the lens of technical analysis.
Moving Averages
having the right tools and strategies at your disposal is essential for success. Among these tools, moving averages stand out as one of the best technical indicators for day trading that can help traders navigate the complexities of the market.
Day traders rely on moving averages to identify trends, gauge market sentiment, and pinpoint potential entry and exit points.
What are Moving Averages?
Moving averages are tools used in trading to smooth out price fluctuations and provide a clearer picture of overall price trends.
There are two main types: Simple Moving Average (SMA) and Exponential Moving Average (EMA). While SMA calculates the average price over a specific period equally, EMA gives more weight to recent prices.
Understanding how these averages are calculated is essential for interpreting their signals accurately. This knowledge helps traders make informed decisions based on trends and potential market movements.
Using Moving Averages to Spot Trends
Moving averages can help you identify different types of trends, whether the market is moving up, down, or sideways. By using moving averages, you can also measure the momentum of these trends, determining their strength and how long they might last. Additionally, moving average crossovers can indicate when trends are changing direction or continuing, giving you insight into potential opportunities or risks in the market.
Putting Theory into Practice
Customizing moving averages allows you to adjust them to match the specific characteristics of different securities you’re trading. By tweaking parameters like the timeframe or the type of moving average, you can better align them with the price movements of each asset. Additionally, combining moving averages with other indicators can enhance the accuracy of your trading signals. This synergy helps you make more informed decisions by leveraging multiple sources of information. Lastly, backtesting your moving average strategies is essential for refining and improving them over time. By analyzing past market data, you can evaluate the effectiveness of your strategies and make adjustments as needed to increase their profitability and reliability.
Relative Strength Index (RSI)
The Relative Strength Index (RSI) is a also one of the best technical indicators for day trading its a popular momentum oscillator used in technical analysis to measure the speed and change of price movements. It was developed by J. Welles Wilder Jr. and first introduced in his book “New Concepts in Technical Trading Systems” in 1978.
RSI is calculated using the following formula:
RSI=100−(100/(1+RS)
Where:
- RS (Relative Strength) = Average GainAverage LossAverage LossAverage Gain
- Average Gain = Average of all upward price changes over a specified period (often 14 days)
- Average Loss = Average of all downward price changes over the same period
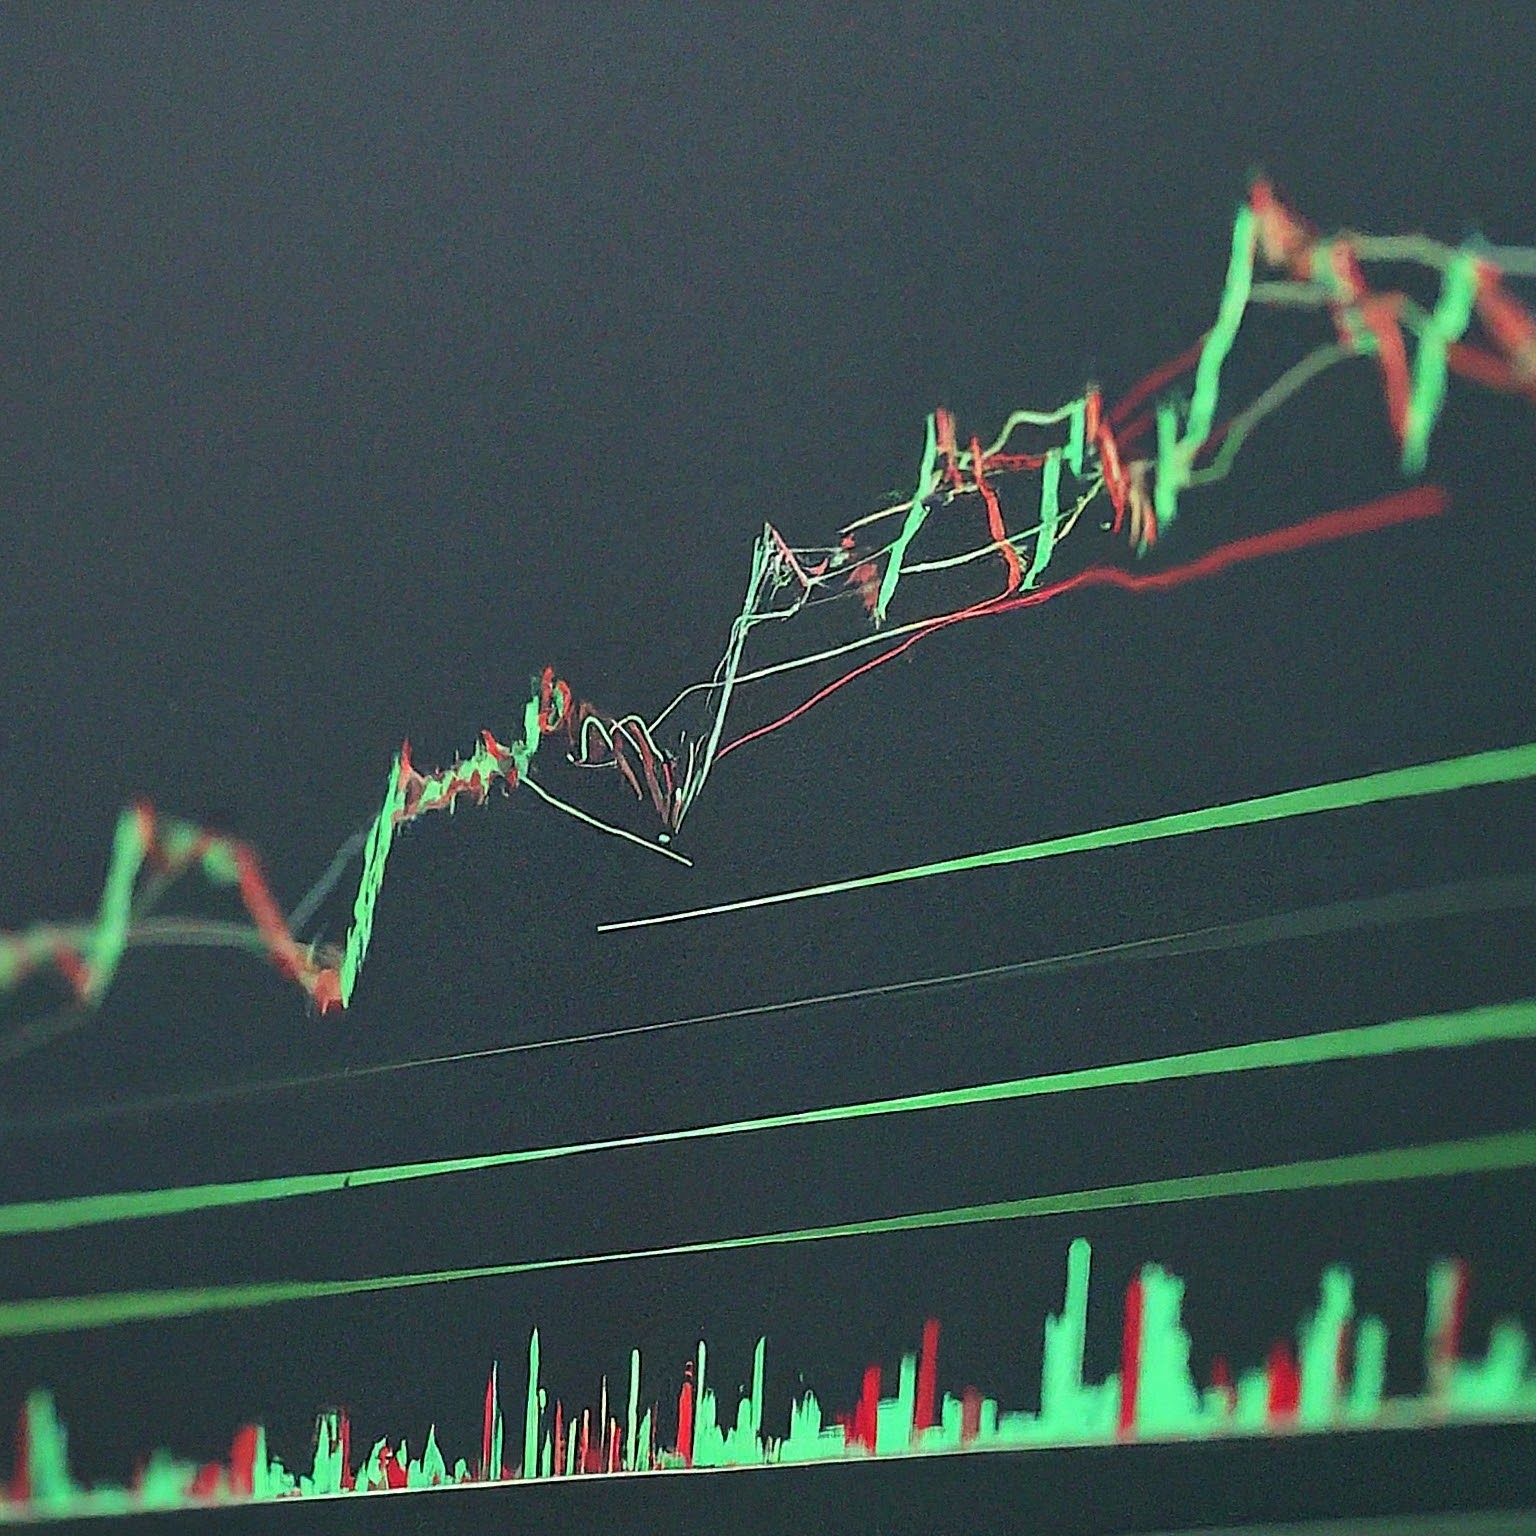
RSI oscillates between 0 and 100. Traditionally, RSI is considered overbought when above 70 and oversold when below 30. However, these levels can be adjusted based on the specific security being analyzed and the trader’s preferences.
Traders use RSI to identify potential trend reversals, overbought or oversold conditions, and divergence between the RSI and the price movements, which might indicate a potential shift in momentum.
It’s important to note that while RSI can be a useful tool, it should not be relied upon in isolation and should be used in conjunction with other technical analysis tools and fundamental analysis for making informed trading decisions.
How to effectively use Relative Strength Index
Effectively using the Relative Strength Index (RSI) involves understanding its signals, incorporating it into a broader trading strategy, and considering its limitations. Here are some tips on how to use RSI effectively:
Identify Overbought and Oversold Conditions: RSI values above 70 typically indicate overbought conditions, suggesting that the price may be due for a correction or reversal. Conversely, RSI values below 30 often signal oversold conditions, indicating that the price may be undervalued and due for a rebound. However, it’s essential to remember that overbought or oversold conditions can persist in strong trends, so RSI should be used alongside other indicators for confirmation.
Look for Divergence: Divergence occurs when the price of an asset moves in the opposite direction of the RSI. Bullish divergence occurs when the price makes a lower low while the RSI makes a higher low, suggesting potential bullish momentum. Conversely, bearish divergence occurs when the price makes a higher high while the RSI makes a lower high, indicating potential bearish momentum.
Consider Trend Confirmation: RSI can be used to confirm the strength of a trend. In an uptrend, RSI tends to stay above 50, while in a downtrend, RSI tends to stay below 50. Traders may look for opportunities to enter long positions when RSI crosses above 50 in an uptrend or short positions when RSI crosses below 50 in a downtrend.
Use Multiple Timeframes: RSI signals can vary depending on the timeframe used. Combining RSI signals from multiple timeframes can provide a more comprehensive view of market sentiment and help filter out noise. For example, a trader may use a longer-term RSI (e.g., 14-day) to identify the overall trend direction and a shorter-term RSI (e.g., 5-day) for timing entries and exits.
Combine with Other Indicators: RSI works best when used in conjunction with other technical indicators, such as moving averages, volume analysis, and trendlines. Combining multiple indicators can help confirm signals and reduce false signals.
Manage Risk: Like any technical indicator, RSI is not foolproof and can generate false signals. Risk management is essential when using RSI to avoid substantial losses. Set stop-loss orders to limit potential losses and consider position sizing based on the level of risk.
Backtest and Practice: Before implementing RSI in live trading, backtest your strategy on historical data to evaluate its performance. Additionally, practice using RSI in a demo or paper trading account to gain experience and confidence in its application.
Overall, using RSI effectively requires a combination of understanding its signals, incorporating it into a broader trading strategy, and practicing disciplined risk management. Traders should also be aware of its limitations and use it as one tool among many in their trading arsenal.
Moving Average Convergence Divergence (MACD)

The Moving Average Convergence Divergence (MACD) is one of the best technical indicators for day trading its a popular momentum indicator used in technical analysis to identify trends and potential trend reversals in a security’s price movement. Gerald Appel developed it in the late 1970s.
MACD is calculated using the following steps:
- Calculate the Short-term Exponential Moving Average (EMA): Typically, a 12-day EMA is used.
- Calculate the Long-term Exponential Moving Average (EMA): Typically, a 26-day EMA is used.
- Compute the MACD Line: Subtract the 26-day EMA from the 12-day EMA.
MACD Line=12-day EMA−26-day EMAMACD Line=12-day EMA−26-day EMA
- Calculate the Signal Line: This is a 9-day EMA of the MACD line.
- Compute the MACD Histogram: This is the difference between the MACD Line and the Signal Line.
MACD Histogram=MACD Line−Signal LineMACD Histogram=MACD Line−Signal Line
The MACD Line, Signal Line, and Histogram are plotted on a chart. Traders use these components to identify potential buy and sell signals:
- MACD Line Crossing Signal Line: When the MACD Line crosses above the Signal Line, it’s considered a bullish signal, suggesting that momentum may be shifting upwards. Conversely, when the MACD Line crosses below the Signal Line, it’s considered a bearish signal, indicating potential downward momentum.
- Histogram Crossing Zero Line: The MACD Histogram crossing above the zero line from below suggests increasing bullish momentum, while crossing below the zero line from above suggests increasing bearish momentum.
- Divergence: Similar to RSI, traders also look for divergence between the MACD Line and the price movement. Bullish divergence occurs when the price makes lower lows while the MACD Line makes higher lows, indicating potential upward momentum. Conversely, bearish divergence occurs when the price makes higher highs while the MACD Line makes lower highs, suggesting potential downward momentum.
MACD can be used in various timeframes and in conjunction with other technical indicators to confirm signals and enhance trading strategies. As with any technical indicator, it’s essential to combine MACD analysis with other forms of analysis and risk management techniques for effective trading decisions.
Bollinger Bands
Bollinger Bands is also one of the best technical indicators for day trading its a technical analysis tool developed by John Bollinger in the 1980s. It consists of a set of three bands plotted on a price chart. The bands are based on a statistical measure known as standard deviation and are used to assess the volatility and potential price movements of a financial instrument.
Here’s how Bollinger Bands are constructed:
- Middle Band (Simple Moving Average): The middle band is typically a 20-period simple moving average (SMA) of the price. This line represents the mean or average price over the specified period.
- Upper Band: The upper band is calculated by adding a specified number of standard deviations (usually 2) above the middle band. The formula for the upper band is:Upper Band=Middle Band+(Multiplier×Standard Deviation)Upper Band=Middle Band+(Multiplier×Standard Deviation)
- Lower Band: The lower band is calculated by subtracting the same number of standard deviations below the middle band. The formula for the lower band is:Lower Band=Middle Band−(Multiplier×Standard Deviation)Lower Band=Middle Band−(Multiplier×Standard Deviation)
The “Multiplier” is typically set to 2, which means the bands will encompass approximately 95% of the price data. However, traders can adjust the multiplier to suit their preferences and market conditions.
How to use Bollinger Bands in forex trading?
Bollinger Bands are primarily used for the following purposes:
Volatility Assessment: When the bands are wide, it indicates high volatility, and when they are narrow, it suggests low volatility. Sudden expansions or contractions of the bands can signal potential changes in volatility levels.
Overbought and Oversold Conditions: In trending markets, prices tend to remain between the upper and lower bands. When the price touches or exceeds the upper band, it may indicate overbought conditions, suggesting that the price may pull back. Conversely, when the price touches or falls below the lower band, it may indicate oversold conditions, suggesting that the price may rebound.
Trend Confirmation: Bollinger Bands can be used to confirm the direction of the trend. In an uptrend, the price tends to stay above the middle band, while in a downtrend, the price tends to stay below the middle band. Traders may look for opportunities to enter long positions when the price bounces off the lower band in an uptrend, or short positions when the price bounces off the upper band in a downtrend.
Bollinger Bands are a versatile tool and can be used in conjunction with other technical indicators and chart patterns to make informed trading decisions. However, like any technical analysis tool, they are not foolproof and should be used in conjunction with risk management techniques.
Stochastic Oscillator
The Stochastic Oscillator is one of the best technical indicators for day trading,its a popular momentum indicator used in technical analysis to identify overbought and oversold conditions in a financial instrument’s price movement. It compares the current closing price of an asset to its price range over a specified period, typically 14 periods. The indicator generates values between 0 and 100.
The calculation of the Stochastic Oscillator involves two main lines:
- %K Line (Fast Stochastic): This line represents the current closing price relative to the range of prices over the selected period. The formula to calculate %K is:
%K=(Closing Price−Lowest LowHighest High−Lowest Low)×100%K=(Highest High−Lowest LowClosing Price−Lowest Low)×100
Where:
- Closing Price is the most recent closing price.
- Lowest Low is the lowest price observed over the specified period.
- Highest High is the highest price observed over the specified period.
- %D Line (Slow Stochastic): This line is a moving average of the %K line and is calculated over a specified number of periods (typically 3). The formula to calculate %D is:
%K=Moving Average of %K%D=Moving Average of %K
The Stochastic Oscillator generates signals based on the position of %K and %D lines relative to certain thresholds, typically 20 and 80:
- Overbought Condition: When the Stochastic Oscillator rises above the 80 level, it suggests that the asset may be overbought, and the price may be due for a pullback or reversal.
- Oversold Condition: When the Stochastic Oscillator falls below the 20 level, it suggests that the asset may be oversold, and the price may be due for a rebound or reversal.
Traders often look for signals such as crossovers between %K and %D lines, divergences between the Stochastic Oscillator and the price movement, and overbought/oversold conditions to make trading decisions.
It’s important to note that like any technical indicator, the Stochastic Oscillator has its limitations and may generate false signals, especially in ranging markets. Therefore, traders often use it in conjunction with other technical indicators and price action analysis for confirmation and to filter out noise. Additionally, risk management techniques should always be applied when trading based on Stochastic Oscillator signals.
Fibonacci Retracement Levels
Fibonacci retracement levels are horizontal lines that indicate potential support and resistance levels based on Fibonacci ratios. These levels are commonly used in technical analysis to identify areas where an asset’s price may reverse direction or continue its trend after a retracement. The key Fibonacci retracement levels include:
- 0.236 (23.6%): This level represents a common retracement level, indicating that the price has retraced approximately 23.6% of the previous move.
- 0.382 (38.2%): Another common retracement level, suggesting that the price has retraced around 38.2% of the previous move.
- 0.500 (50%): This level is not a Fibonacci ratio but is included in Fibonacci retracement analysis as it represents a simple half retracement of the previous move.
- 0.618 (61.8%): Considered one of the most significant Fibonacci retracement levels, indicating that the price has retraced approximately 61.8% of the previous move. This level is often referred to as the “golden ratio.”
- 0.786 (78.6%): This level is sometimes included in Fibonacci retracement analysis, suggesting a retracement of approximately 78.6% of the previous move.
- 1.000 (100%): Not a retracement level but rather the starting point of the original move. Some traders use this level as a target for the price to reach after a retracement.
To apply Fibonacci retracement levels, traders identify a significant swing low and swing high on a price chart and then draw the Fibonacci retracement tool from the low to the high (or vice versa). The retracement levels are automatically generated based on the Fibonacci ratios mentioned above.
How traders use Fibonacci retracement levels?
Traders use Fibonacci retracement levels in various ways:
- Support and Resistance: The retracement levels act as potential support levels during an uptrend and resistance levels during a downtrend. Traders may look for price reactions such as bounces or reversals at these levels.
- Entry and Exit Points: Fibonacci retracement levels can be used to identify potential entry points for trades after a retracement. Traders may enter long positions near support levels in an uptrend or short positions near resistance levels in a downtrend. They may also use Fibonacci extension levels as potential profit targets.
- Confirmation with Other Indicators: Fibonacci retracement levels are often used in conjunction with other technical indicators, chart patterns, or trendlines to confirm trading signals and increase the probability of successful trades.
It’s essential to note that while Fibonacci retracement levels can be valuable tools in technical analysis, they should not be used in isolation. Traders should consider other factors such as market conditions, trend direction, volume, and fundamental analysis when making trading decisions. Additionally, Fibonacci retracement levels are not always precise and may vary depending on the timeframe and market volatility.
Average True Range (ATR)
The Average True Range (ATR) is one of the best technical indicators for day trading,its a technical indicator used in financial markets to measure the volatility of an asset’s price movement. Developed by J. Welles Wilder Jr., the ATR aims to provide traders with insights into the expected price range of an asset over a specified period.
The ATR is calculated using the following steps:
- True Range (TR): The True Range is the greatest of the following three values:
- Current High minus the current Low
- Absolute value of the Current High minus the previous Close
- Absolute value of the Current Low minus the previous Close
- Average True Range (ATR): The ATR is typically calculated as an exponential moving average (EMA) of the True Range over a specified period (usually 14 periods).
Mathematically, the ATR can be expressed as follows:
ATR=Previous ATR×(Period−1)+Current TRPeriodATR=PeriodPrevious ATR×(Period−1)+Current TR
Where:
- Previous ATR is the ATR value from the previous period.
- Period is the number of periods used in the calculation (often 14).
- Current TR is the True Range calculated for the current period.
The ATR value represents the average price range of an asset over the specified period, considering price gaps and limit moves. A higher ATR value indicates higher volatility, while a lower ATR value suggests lower volatility.
How raders use the ATR?
Traders use the ATR in various ways:
Volatility Measurement: Traders use the ATR to gauge the volatility of an asset. Higher ATR values indicate greater volatility, which may lead to larger price movements and wider trading ranges.
Setting Stop Loss and Take Profit Levels: The ATR can help traders determine appropriate levels for setting stop-loss orders and take-profit targets. In volatile markets, wider stop-loss orders may be needed to account for larger price fluctuations, while in less volatile markets, tighter stop-loss orders may suffice.
Position Sizing: Traders may adjust their position sizes based on the current ATR value. In high volatility environments, traders may reduce position sizes to manage risk effectively, while in low volatility environments, larger position sizes may be considered.
Trend Confirmation: Changes in the ATR value can sometimes signal potential shifts in market sentiment or trend strength. For example, increasing ATR values during an uptrend may indicate strengthening momentum, while decreasing ATR values could suggest weakening momentum.
Trading Breakouts: Traders may use the ATR to identify potential breakout opportunities. Breakouts above or below recent ATR-defined trading ranges may signal significant price movements and potential trading opportunities.
Overall, the Average True Range is a versatile tool that helps traders assess market volatility, manage risk, and make informed trading decisions. It’s essential to understand that the ATR is a relative measure of volatility and should be used in conjunction with other technical indicators and trading strategies for comprehensive analysis.
Ichimoku Cloud
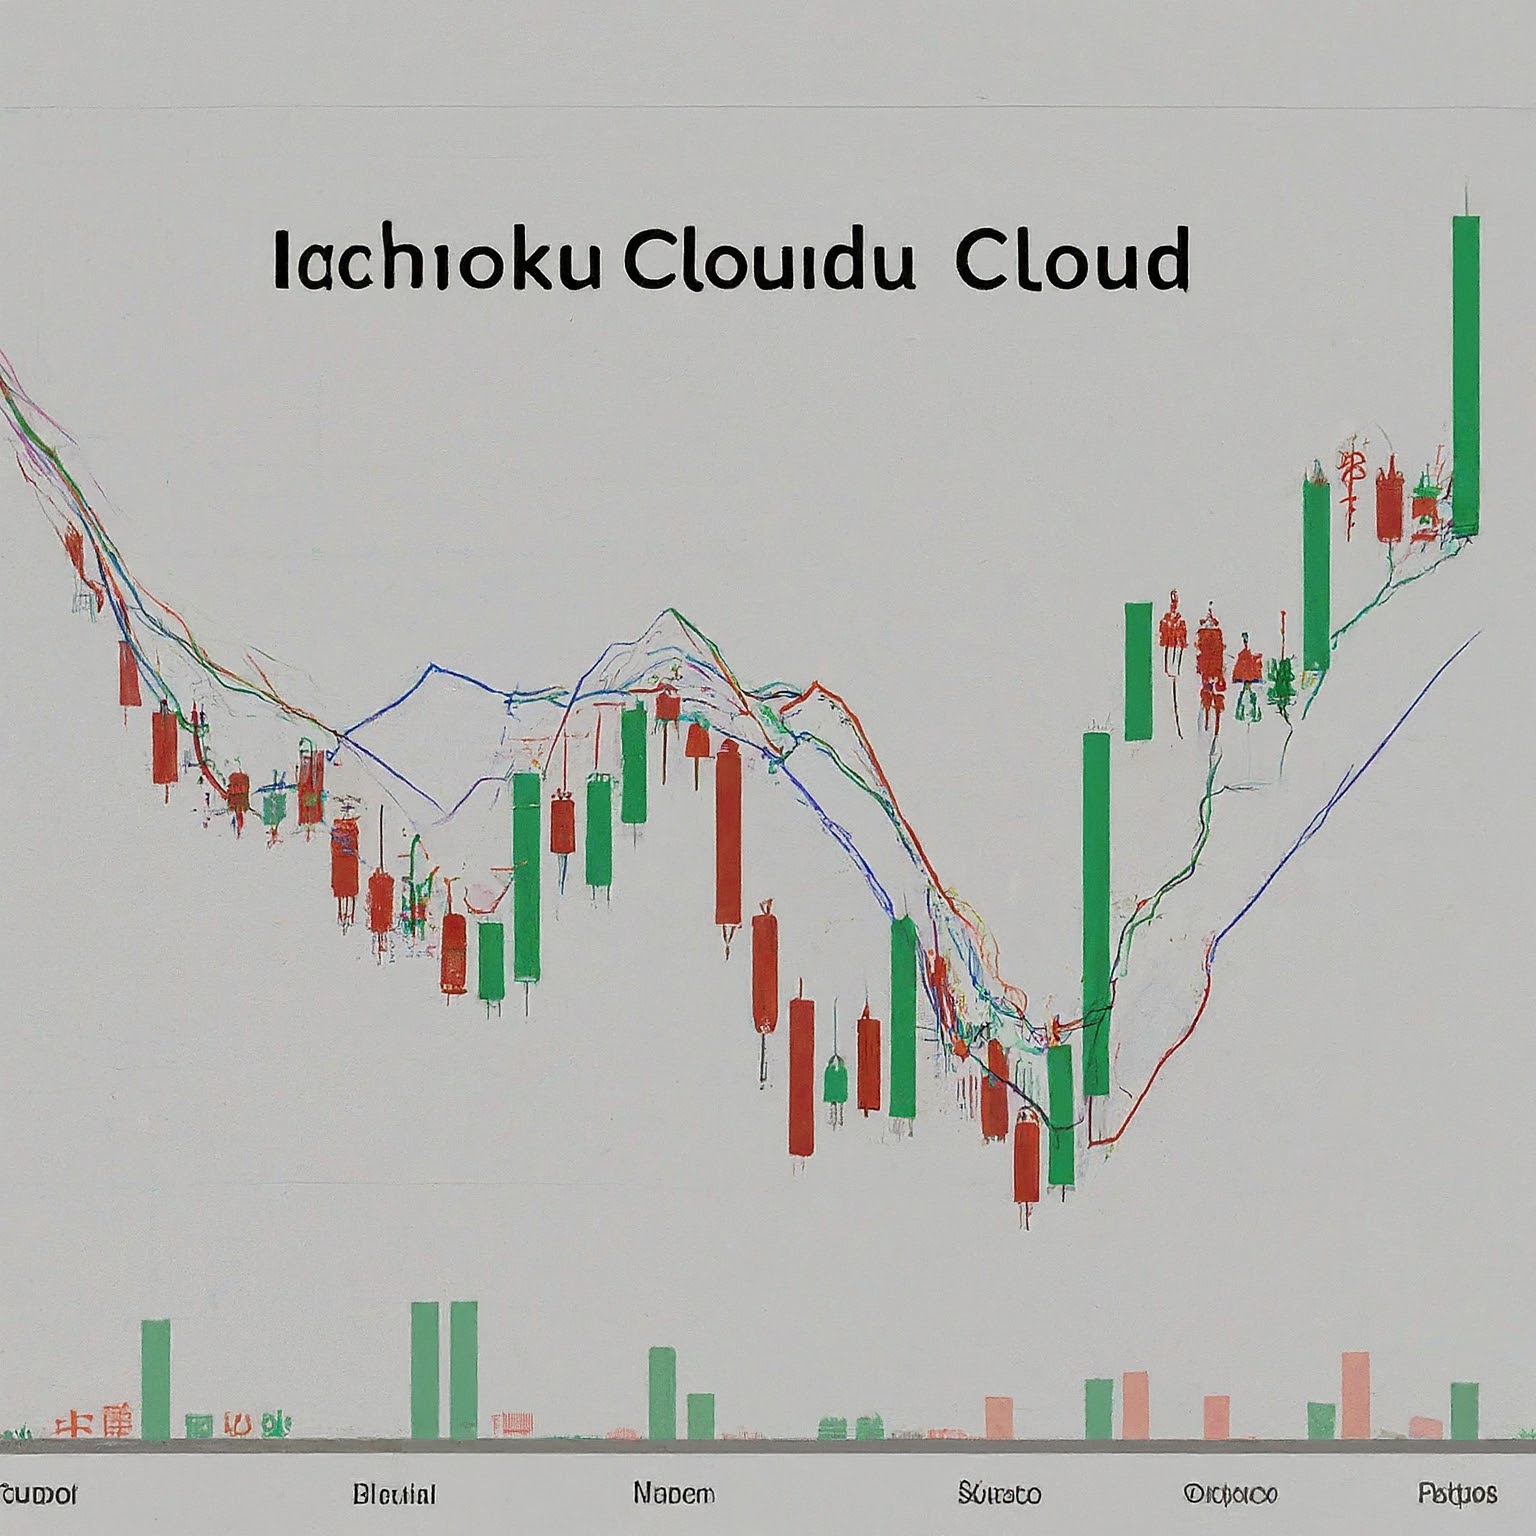
The Ichimoku Cloud, also known as Ichimoku Kinko Hyo, is a tool created by a Japanese journalist named Goichi Hosoda in the late 1930s to help traders analyze the market. It’s one of the best technical indicators for day trading,it called the “one glance equilibrium chart” because it gives a quick overview of price movements. The cloud has different parts:
Tenkan-sen (Conversion Line): It’s a short-term trend line calculated as the middle point between the highest high and lowest low over the last nine periods.
Kijun-sen (Base Line): Similar to Tenkan-sen but calculated over the last 26 periods, giving a view of the intermediate-term trend.
Senkou Span A (Leading Span A): It’s the average of Tenkan-sen and Kijun-sen plotted 26 periods ahead, forming one edge of the cloud and showing potential future support or resistance.
Senkou Span B (Leading Span B): This is the midpoint of the highest high and the lowest low over the past 52 periods, plotted 26 periods ahead, forming the other edge of the cloud and showing potential future support or resistance.
Chikou Span (Lagging Span): It’s the closing price of the current candlestick plotted 26 periods in the past, helping to identify the strength and direction of the current trend.
Kumo (Cloud): This is the area between Senkou Span A and Senkou Span B. The color of the cloud changes depending on whether Senkou Span A is above or below Senkou Span B. When Senkou Span A is above, the cloud is typically green, indicating potential support, and when Senkou Span A is below, the cloud is red, indicating potential resistance.
Traders use the Ichimoku Cloud for various purposes, including:
- Trend Identification: Traders look for the position of price relative to the cloud to identify the current trend. In an uptrend, the price tends to remain above the cloud, while in a downtrend, the price tends to remain below the cloud.
- Support and Resistance: Traders use the edges of the cloud (Senkou Span A and Senkou Span B) as dynamic support and resistance levels.
- Trading Signals: Traders look for various signals generated by the components of the Ichimoku Cloud, such as Kumo breaks, Tenkan-sen/Kijun-sen crosses, and Chikou Span confirmation, to make trading decisions.
- Confirmation: The Ichimoku Cloud can be used in conjunction with other technical indicators to confirm trading signals and increase the probability of successful trades.
The Ichimoku Cloud is a versatile tool that can be applied to various markets and timeframes. However, like any technical analysis tool, it’s essential to practice and combine it with other forms of analysis for effective trading decisions.
Volume Weighted Average Price (VWAP)
The Volume Weighted Average Price (VWAP) is really one of the best technical indicators for day trading ,its a trading indicator used to calculate the average price of a financial asset over a specific period, taking into account both price and volume. It’s commonly used by traders, especially institutional traders, to gauge the average price at which a particular asset has traded throughout the day.
To calculate VWAP, the following steps are typically taken:
- Calculate Typical Price: The typical price for each period is calculated as the average of the high, low, and closing prices for that period.
Typical Price=High+Low+Close3Typical Price=3High+Low+Close
- Calculate Volume-Weighted Typical Price: Multiply the typical price by the volume for each period.
Volume-Weighted Typical Price=Typical Price×VolumeVolume-Weighted Typical Price=Typical Price×Volume
- Sum the Volume-Weighted Typical Prices: Sum up the volume-weighted typical prices for all periods within the specified time frame.
- Sum the Volume: Also, sum up the volume for all periods within the specified time frame.
- Calculate VWAP: Finally, divide the sum of the volume-weighted typical prices by the sum of the volume.
VWAP=Sum of Volume-Weighted Typical PricesSum of VolumeVWAP=Sum of VolumeSum of Volume-Weighted Typical Prices
The VWAP is typically recalculated at the beginning of each trading day and updated continuously throughout the day. It’s often plotted on intraday charts as a single line and can be used by traders as a reference point to assess whether the current price is above or below the average price traded for the day.
Traders use VWAP in various ways:
- Execution Benchmark: Institutional traders use VWAP as a benchmark for executing large orders. They aim to execute trades at prices better than the VWAP to minimize market impact.
- Trend Confirmation: Some traders use VWAP to confirm the direction of the trend. If the current price is above VWAP, it may indicate bullish sentiment, while if the current price is below VWAP, it may indicate bearish sentiment.
- Support and Resistance: VWAP can act as a support or resistance level. If the price moves away from VWAP, it may act as a magnet, pulling the price back toward it.
Overall, VWAP is a useful tool for traders to assess the average price at which a security has traded over a specific period, providing insights into market sentiment and potential trading opportunities.
Conclusion
These indicators can be used individually or in combination to form a trading strategy tailored to the trader’s preferences and objectives. It’s essential to understand each indicator’s strengths and limitations and to practice using them in different market conditions to develop proficiency. Additionally, risk management techniques should always be applied to minimize losses and protect trading capital. Ultimately, the best combination of technical indicators for day trading will vary from trader to trader and may require experimentation and refinement over time.